

If you’re investing in vacation rentals, putting all your resources in one market can be risky. Diversifying across different cities reduces exposure to local regulations, economic downturns, and seasonal slumps. By targeting markets with varied demand drivers – like theme parks, festivals, or beachgoers – you can stabilize your income year-round. Here are the highlights:
- Orlando, FL: Steady demand from theme park tourism, especially Disney World, with occupancy rates around 69% in key submarkets.
- Miami, FL: Year-round demand from international travelers and luxury-seeking guests, offering high ADRs and consistent occupancy.
- Austin, TX: Event-driven market with spikes during SXSW and Formula 1, plus weekday tech industry demand.
- New Orleans, LA: Seasonal tourism driven by festivals like Mardi Gras and Jazz Fest, with strong revenue during peak periods.
- Las Vegas, NV: Balanced demand from conventions and entertainment, ensuring steady bookings.
- North Myrtle Beach, SC: High summer occupancy and affordable beachfront properties.
- Coastal Markets (e.g., Port Arthur, TX): Affordable entry points with a mix of business and leisure demand.
- Gulf Shores, AL: Popular with families, offering budget-friendly investment opportunities and strong summer revenue.
Diversification protects against market-specific risks while maximizing returns. Each market has unique strengths, from Orlando’s family tourism to Miami’s luxury rentals. The key is understanding local demand and regulations. Partnering with professional property managers can help you optimize performance and navigate challenges.
Top 8 Vacation Rental Markets Comparison: Occupancy, Rates, Revenue & Entry Costs
1. Orlando, Florida: Year-Round Theme Park Tourism
Primary Demand Driver
Walt Disney World attracts over 50 million visitors every year, providing a steady stream of tourists and ensuring market stability [3]. Most theme park visitors come as families or multi-generational groups, typically booking stays of 4 to 7 nights [3]. On top of that, Universal’s continuous growth – especially with the Epic Universe project – adds more capacity and strengthens future demand [3].
"Theme park visitors are ideal vacation rental guests: Families needing multiple bedrooms, extended stays (4–7 nights typical), and groups seeking kitchen access." – Weekender Management [3]
This massive and consistent visitor base supports high occupancy rates, which are key for reliable returns.
Occupancy Stability
The Lake Buena Vista submarket, located near Disney World, boasts a 69% occupancy rate with an average daily rate of $227 [5]. However, the broader Orlando market sees a lower average occupancy rate of 45.2%, largely because of its higher inventory levels.
Investment Entry Point
Median home prices in this area are accessible, ranging from around $341,000 in Davenport to $367,000 in Orlando. However, properties without pools tend to underperform in this market [3][6]. Investors also benefit from low regulatory barriers for short-term rentals, which help minimize compliance costs and speed up the process of getting properties rental-ready [6].
Revenue Potential
These favorable conditions translate into strong revenue opportunities. Large single-family homes with 6 to 12 bedrooms can bring in $80,000 to over $200,000 annually. Standard single-family homes with 4 to 6 bedrooms typically generate between $50,000 and $100,000 per year [3]. Smaller condos or townhomes with 2 to 4 bedrooms earn around $30,000 to $60,000 annually [3]. Properties with themed rooms – like Star Wars or princess designs – often command higher rates [3]. In the Lake Buena Vista area specifically, properties average $58,698 in annual revenue [5].
sbb-itb-103bddb
2. Miami and South Florida: Luxury Segment Focus
Primary Demand Driver
Miami’s luxury vacation rental market plays a key role in balancing a diversified portfolio, especially when compared to destinations that rely heavily on seasonal or event-driven demand. Unlike those locales, Miami enjoys a steady flow of international visitors, business travelers, and "bleisure" guests throughout the year. This consistency makes it an attractive option for upscale whole-home rentals, which cater to travelers seeking privacy and extra space. The market, after experiencing rapid growth, has now entered a more stable phase, avoiding the wild fluctuations seen in other popular hubs [4].
One standout feature of this segment is its pricing power. In 2025, the average daily rates (ADR) for luxury listings grew by 5.23% year-over-year, while budget-tier properties saw a slight decline of 0.33% during the same period [9]. This steady demand has translated into strong and consistent occupancy rates.
Occupancy Stability
Occupancy rates in Miami range from 62% to 69%, outperforming the U.S. national average of 60.91%. The city’s ADR hovers around $228 [4][5]. What drives this stability? A diverse mix of travelers, including international tourists, domestic vacationers, and business guests, ensures bookings remain consistent year-round.
Nearby Fort Lauderdale also performs well, with average monthly revenue of $3,948 – higher than Miami’s $3,185 [6]. This reliable performance makes South Florida a promising area for investment in the luxury rental market.
Investment Entry Point
Miami is one of the top 10 largest Airbnb markets in the U.S., with over 7,200 active listings [5]. The city’s relatively lenient short-term rental regulations and the potential for professional staging and design – shown to boost revenue by up to 40% – make it a compelling option for investors, despite higher property acquisition costs [6][7][11]. However, rules vary by location: Miami Beach enforces strict licensing requirements, while Fort Lauderdale has a more relaxed regulatory environment [6].
Revenue Potential
The average annual revenue for Miami vacation rentals is approximately $51,798, with rental yields around 12.3% [5]. Miami Beach properties command an ADR of $364, while Fort Lauderdale slightly edges ahead at $368 per night [6]. Luxury properties, in particular, benefit from lower expense ratios, as their higher nightly rates help offset fixed costs like cleaning and maintenance [10].
To maximize returns, professional management and dynamic pricing are critical. These tools help capture higher rates during peak demand periods while maintaining steady occupancy during slower times [8]. In Miami’s high-demand market, vacation rental ROI typically falls between 8% and 12%, with luxury properties often hitting the upper end of that range [8].
3. Austin, Texas: Event-Driven and Tech-Sector Growth
Primary Demand Driver
Austin thrives on a mix of event-driven tourism and consistent weekday demand from its booming tech industry. Big-name events like South by Southwest (SXSW) push occupancy rates in central areas to an impressive 95–98%, while Formula 1 races see luxury rentals fetching over $1,000 per night [14]. Meanwhile, the tech sector, often referred to as "Silicon Hills", keeps business travel steady during the week, particularly near The Domain in North Austin, where occupancy rates hover between 50–60% year-round [14].
However, Austin’s rapid expansion has led to an oversaturated market. The city now has 9,167 short-term rental listings, more than doubling from 4,500 just seven years ago. As a result, city-wide occupancy has dropped from 68–70% to roughly 60% [2][12].
Occupancy Stability
Occupancy rates differ significantly across Austin’s neighborhoods. Downtown and Rainey Street perform well, maintaining 65–75% occupancy due to their proximity to the Convention Center and vibrant nightlife. South Congress and Zilker hold steady at 60–70%, thanks to attractions like the ACL Festival and Barton Springs. East Austin, known for its trendy food scene and younger crowd, sees rates in the 55–65% range, while North Austin’s Domain area, a tech hub, remains consistent at 50–60% [14].
For investors, success often hinges on quality over quantity. Properties with standout features – like stylish interiors, premium amenities (think pools or hot tubs), or accolades such as Airbnb’s "Guest Favorite" status – tend to outperform more generic options.
Investment Entry Point
As of early 2026, Austin presents a prime opportunity for buyers. Lucas Piper, Founder of Five Star Vacation Home Rentals, describes the current climate:
"We are the worst real estate market in the nation for sellers right now, very bad for sellers, very good for buyers" [12].
This buyer-friendly market allows for creative financing options and access to below-market interest rates from motivated sellers. Additionally, recent regulatory changes in 2024 and 2026 have simplified the licensing process for non-owner-occupied short-term rentals (Type 2) [12][14].
Investors should pay attention to promising submarkets like the 78704 zip code, which includes high-demand areas like Zilker and Bouldin, or East Austin, where property prices are more affordable and growth potential is strong. Many investors are also leveraging 100% bonus depreciation, a tax advantage not available with long-term rentals [12].
These conditions create a favorable environment for generating strong returns.
Revenue Potential
The average short-term rental in Austin brings in about $3,740 per month, with daily rates ranging from $212 to $260 [13][14]. During major events, properties – especially those downtown – can charge two to three times their usual rates, often doubling the income of long-term leases [13][14]. Using dynamic pricing strategies to adjust rates for events like SXSW or Formula 1 can increase annual revenue by 20–30% [14].
However, the market is not without challenges. Expert Tabitha LeJeune emphasizes that stricter regulations, rising home prices, and growing competition require a calculated approach [13]. Newcomers face stiff competition from seasoned operators with strong reviews and advanced pricing tools. To succeed, investors must focus on standout amenities, thoughtful design, and data-driven submarket analysis to find areas where supply and demand are well-balanced. These strategies ensure Austin remains a key player in a diversified vacation rental portfolio. For those looking to scale, understanding how vacation rentals can be managed across multiple locations is essential for long-term success.
4. New Orleans, Louisiana: Festivals and Tourism
Primary Demand Driver
New Orleans thrives on its vibrant festival scene, with events like Mardi Gras, Jazz Fest, and a variety of food and music festivals driving its economy. The city sees peak tourism activity from February to May and again in October through November [15]. This festival-heavy calendar helps balance the risks of markets with steadier, year-round demand. With 5,138 active short-term rental listings, New Orleans has firmly established itself as a key destination for visitors [15]. The city’s seasonal rhythm plays a significant role in shaping occupancy trends.
Occupancy Stability
New Orleans has a median occupancy rate of 56%, reflecting its seasonal nature [15]. While occupancy dipped by 5.1% year-over-year, average daily rates climbed 10.5% to $188, showcasing the market’s ability to command higher prices during festivals and other peak periods [15]. Neighborhoods like Central City see an average daily rate of $219, whereas the French Quarter averages $126, illustrating the price variation across different areas [15].
Investment Entry Point
New Orleans ranks 22nd among top Airbnb markets due to its strict licensing requirements and well-regulated permit system [5]. The number of active listings has grown by 15.3% over the past year and an impressive 58.3% over three years [15]. For investors, understanding and navigating these regulations is essential for success. Those who do can tap into the city’s robust tourism infrastructure, making it an appealing choice for portfolio diversification.
Revenue Potential
Short-term rentals in New Orleans generate a median annual revenue of $40,000, with the average property earning around $39,552 per year [15][5]. This represents a 5.0% year-over-year increase, primarily driven by rising nightly rates during major events rather than higher occupancy [15]. Hosts who use dynamic pricing strategies during festivals can significantly boost their annual revenue, helping to compensate for slower periods in the summer and winter. Effective calendar management and responsive pricing tools are critical for maximizing returns in this market. Many investors find that professional property management provides the expertise needed to navigate these complexities.
The Ultimate Guide to Financial Forecasting for Vacation Rentals
5. Las Vegas, Nevada: Convention and Entertainment Hub
Las Vegas stands out as a prime market for expanding vacation rental portfolios, offering a unique mix of entertainment and business-driven demand.
Primary Demand Driver
Las Vegas thrives as a year-round destination, thanks to iconic attractions like The Strip and Fremont Street. Major events like the CES (Consumer Electronics Show) and the Electric Daisy Carnival, along with professional sports tournaments, create significant spikes in occupancy. The city’s ability to draw both convention-goers and holiday travelers, particularly during the spring and fall convention seasons, gives it an edge over cities reliant on seasonal festivals[11].
Occupancy Stability
Las Vegas boasts an average occupancy rate of 60% across approximately 11,329 active short-term rental listings[5]. Daily rates typically fall between $150 and $250, with one study citing an average of $199[5][11]. What sets Las Vegas apart is its steady mix of mid-week business travelers and weekend leisure guests. Properties close to The Strip or major convention venues tend to command higher rates during high-profile events while maintaining steady bookings during slower periods. This balance makes it an appealing option for investors seeking consistent returns.
Investment Entry Point
For those looking to diversify, Las Vegas offers a blend of affordability and growth potential. Property values generally range from $250,000 to $450,000, making it a cost-effective choice for vacation rental investments[11]. The regulatory environment is also relatively investor-friendly, further enhancing its appeal[5]. For comparison, city-center apartments in Las Vegas average $3,062 per square meter – far more affordable than New York City’s $17,733[11]. This affordability translates to a faster return on investment[11].
Revenue Potential
On average, short-term rentals in Las Vegas generate annual revenues of around $45,066, with yields reaching approximately 12.3%[5]. Properties near convention centers often attract business travelers during the week, while those close to entertainment hotspots capture strong weekend demand[11]. This dual demand from both business and leisure travelers provides a reliable foundation for diversifying any rental portfolio.
6. North Myrtle Beach, South Carolina: High ROI Beach Market
North Myrtle Beach stands out as a coastal market with strong return-on-investment potential. It combines relatively low property prices with solid seasonal revenue opportunities, making it a valuable addition for investors looking to diversify their portfolios with beach properties.
Primary Demand Driver
A key factor driving demand in North Myrtle Beach is its location along the Grand Strand, a major tourist hotspot that draws 18.1 million visitors annually [17]. This steady flow of tourists supports the area’s 4,047 active short-term rental listings [16]. The market leans toward larger beach houses rather than condos, catering to families and groups who prioritize space and proximity to the water [17]. With an average daily rate of $361 [16], the area delivers strong revenue potential, particularly during the 14-week summer season between Memorial Day and Labor Day. Peak occupancy hits 90.3% in July, though it dips significantly to 29% in January [17].
Investment Entry Point
For investors, North Myrtle Beach offers an attractive entry point due to its "beachfront effect" – lower property costs paired with high seasonal demand [11]. As of May 2026, the area maintains a "Low" regulation profile [16], meaning fewer compliance hurdles and a smoother path to market entry. Oceanfront condos are relatively affordable, typically ranging from $150,000 to $250,000 [17]. However, it’s crucial to check HOA rules before purchasing, as some associations restrict short-term rentals regardless of zoning [7].
Revenue Potential
Properties in North Myrtle Beach generate an average of $2,854 per month, with annual revenues estimated at around $44,304 [17]. Notably, about 60% of this income is concentrated in the summer peak season [16]. As Edgar Moreno from StaySTRA notes:
"Myrtle Beach plays a seasonal song, and the investors who succeed here are the ones who know the rhythm" [17].
This highlights the importance of strategic pricing during peak months to offset the slower winter period. By capitalizing on this seasonal rhythm, investors can add a high-performing beach market to their portfolio.
7. Coastal Markets (Maine, Rhode Island, Northwest Florida): Growing Opportunities
Emerging coastal markets are creating new possibilities for investors, offering alternatives to the well-trodden beach destinations. These regions are attracting travelers to smaller cities and rural areas, presenting a chance for diversification.
Primary Demand Driver
During the pandemic, nontraditional coastal destinations gained popularity – and their appeal hasn’t faded. Jamie Lane, Chief Economist at AirDNA, highlights this trend:
"When we look at the types of markets that continually come up top of the list, it’s not your traditional beach or mountain markets. It’s a trend that shows people want to travel and see rural areas around the country." [1]
Take Destin, for example. It boasts a daily rate of $462 with 44% occupancy, and booking lead times average 64.7 days. Meanwhile, Port Arthur, Texas, combines coastal charm with demand from the oil and gas industry. This dual-purpose appeal has driven a 23% supply increase between 2024 and 2025, while maintaining an impressive 78% occupancy rate [1][2]. These factors contribute to steadier booking patterns, making these markets more predictable for investors.
Occupancy Stability
Traditional beach markets often experience sharp seasonal swings. For instance, Northwest Florida’s summer occupancy hits 60–70%, but it drops below 30% during winter [2]. On the other hand, emerging coastal markets with a mix of leisure and business demand show greater consistency. Port Arthur stands out with a 78% occupancy rate, far exceeding Destin’s 44% and Gulf Shores’ 43% [1][2]. To navigate these fluctuations, investors should stress-test properties at 35–40% occupancy to ensure they remain profitable during slower periods [2].
Investment Entry Point
Affordability is a major draw for these secondary markets. For example, Port Arthur’s median list price is around $151,265 – significantly lower than prices in more established beach destinations [1]. This lower entry cost not only reduces risk but also makes it easier to achieve solid returns. With mortgage rates having decreased over the last two years, coastal short-term rentals have become more accessible in 2026 [1]. Partnering with experienced operators like Rank One Stays can help investors navigate these markets effectively and maximize returns through professional management.
Revenue Potential
The combination of affordability and steady demand creates strong revenue opportunities in these markets. Destin, for example, generates about $39,186 in annual revenue [2]. Meanwhile, Port Arthur offers an average annual revenue of $35,000 [1], which is impressive when weighed against its lower property prices. Gulf Shores, Alabama, also performs well, with a trailing twelve-month revenue of $34,748 and an average daily rate of $405 [2]. By focusing on markets with lower acquisition costs, investors can achieve better overall returns, even if gross revenue figures are slightly lower compared to pricier destinations.
8. Gulf Shores, Alabama: Secondary Beach Destination
Gulf Shores, Alabama, is carving out its place as a sought-after secondary beach destination, especially for families looking for an affordable coastal getaway.
Primary Demand Driver
This drive-to destination draws budget-conscious families from cities like Birmingham and Nashville[20][21]. Visitors typically book stays of 5–6 nights, with an average booking window of about 115 days[18]. Gulf Shores shines during the summer, with top-performing properties reaching occupancy rates of 82–85% in June and July[18]. Its appeal lies in attractions like white sand beaches, Gulf State Park, and family-friendly spots such as Waterville USA and The Hangout[21].
Occupancy Stability
Seasonality plays a significant role in Gulf Shores’ rental market. The annual occupancy rate averages 38.8%, with July peaking at around 63.6% and January dropping to 23.2%[21][22]. Despite a year-over-year supply increase of 82.9%, demand continues to outpace inventory growth[21][22]. Conference traffic and events help boost shoulder season numbers, while the winter months appeal to snowbirds and remote workers, with the average January stay extending to 8.9 nights[21].
Investment Entry Point
With a median home price of approximately $430,833, Gulf Shores offers a more affordable entry point compared to premium Florida destinations like Destin ($580,667) but sits above Myrtle Beach ($268,000)[19][20]. Regulations are relatively light, requiring only a city business license and triennial safety inspections – though zoning restrictions should be checked before purchasing[18][19]. Coastal insurance costs, including wind, hurricane, and flood coverage, are essential to factor in, as they can significantly affect profitability. The market leans heavily toward condos, with about 4,781 units available, offering a range of investment opportunities[18].
Revenue Potential
Gulf Shores delivers solid returns, with an average daily rate of $408[19][21] and monthly revenue averaging $3,691[19]. High-performing properties can generate around $49,000 annually, surpassing nearby Orange Beach[20][19]. Summer nightly rates often exceed $400, while off-season rates hover around $334[18][21]. Lodging taxes total 16% (4% state, 10% city, 2% CVB)[18]. Mid-market condos located a few blocks from the beach typically offer steady occupancy and lower maintenance costs compared to premium beachfront units, which, while commanding higher rates, come with elevated HOA fees and insurance expenses[18]. Rising insurance premiums in Florida are also driving investors to Gulf Shores, where entry costs are more manageable[20]. These factors make Gulf Shores an attractive option for investors seeking affordable entry points and reliable summer income.
Market Comparison Table
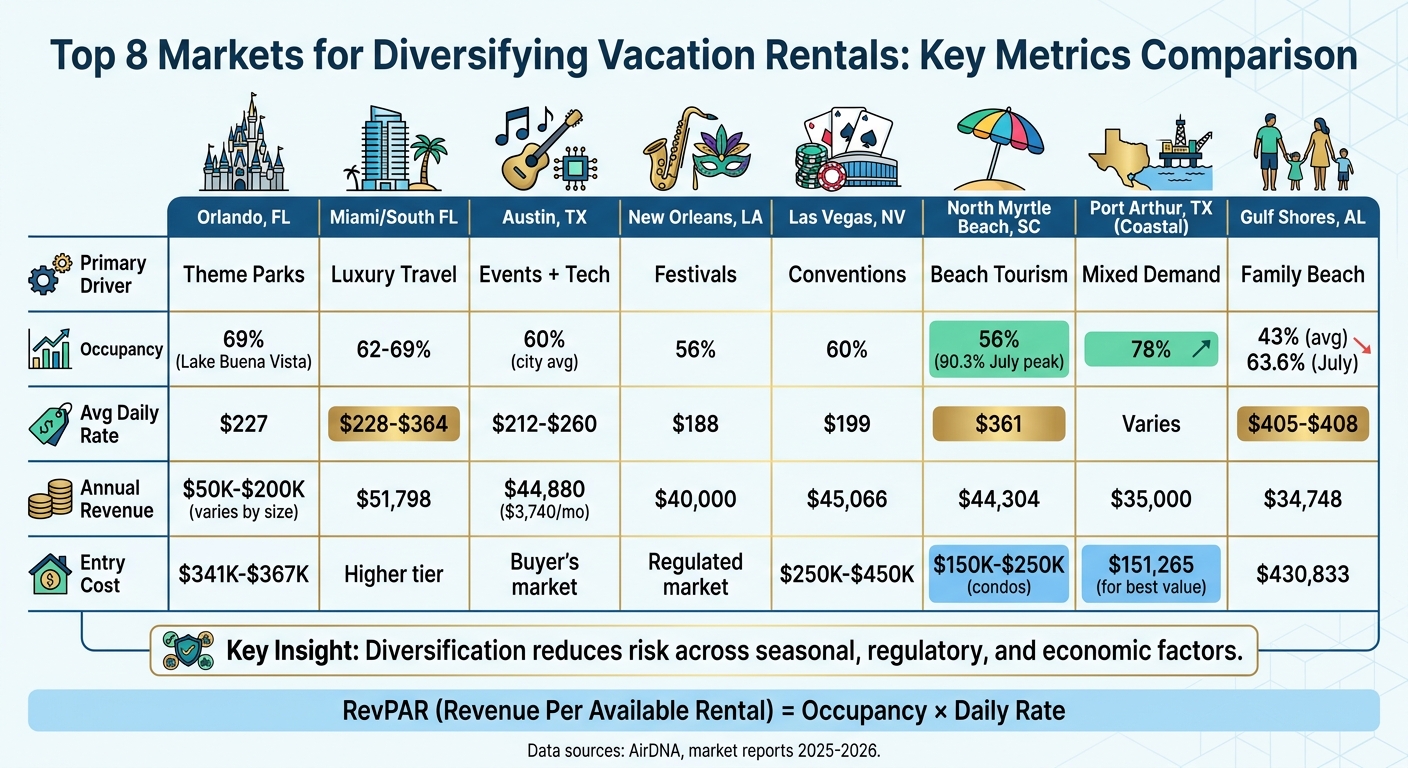
Here’s a side-by-side look at eight markets based on key metrics like occupancy, nightly rates, annual revenue, and entry costs. This snapshot highlights how spreading investments across various markets can help balance occupancy and revenue outcomes.
| Market | Primary Demand Driver | Occupancy Rate | Average Daily Rate | Annual Revenue | Median Entry Cost ($) |
|---|---|---|---|---|---|
| Orlando, FL | Theme parks | 68% | – | $48,000 | – |
| Miami/South FL | Luxury travel | – | – | – | – |
| Austin, TX | Events and tech | ~60% | $292 | – | – |
| New Orleans, LA | Festivals | – | – | – | – |
| Las Vegas, NV | Conventions | – | – | – | – |
| North Myrtle Beach, SC | Beach access | 56% | $420 | $47,943 | $450,000 |
| Coastal Markets | Seasonal tourism | Varies | – | – | Varies |
| Gulf Shores, AL | Beach destination | 43% | $405 | $34,748 | $430,833 |
Orlando stands out for consistent bookings, while North Myrtle Beach boasts high nightly rates. Gulf Shores emerges as a more budget-friendly entry point for investors. Many investors lean toward regulated markets in Florida and Texas, appreciating their stability. When evaluating potential investments, remember that Revenue Per Available Rental (RevPAR) – a combination of nightly rate and occupancy – is a key metric to guide your decisions.
Conclusion
Diversifying your vacation rental portfolio across multiple markets offers a solid way to protect against seasonal dips, regulatory changes, and local economic shifts. By investing in properties tied to different demand drivers – like Orlando’s theme parks, New Orleans’ festivals, Las Vegas’ conventions, or the beaches of North Myrtle Beach – you can create a more stable income stream throughout the year. That said, managing such a varied portfolio requires expertise and careful oversight. As Jamie Lane, Chief Economist at AirDNA, wisely points out:
"Just because an area has high revenue potential, that doesn’t necessarily mean it’s a good investment. We have to look at that in relation to the cost of the home." [1]
Handling properties across diverse markets calls for professional systems to ensure smooth operations. While the unique demand factors of each location can help balance your portfolio, achieving optimal performance often depends on specialized management strategies.
Rank One Stays provides full-service property management designed to increase revenue by 38%, all with competitive fees starting at just 10%. They currently operate in key markets like Scottsdale, Arizona; Denver, Colorado; Pittsburgh, Pennsylvania; and Lighthouse Point, Florida.
With promising market conditions projected for 2026, professional optimization is more important than ever. Whether you’re looking to expand into new regions or fine-tune the performance of your existing properties, partnering with experienced managers who understand local regulations, seasonal trends, and pricing strategies can transform average returns into exceptional profits. In the end, tapping into professional management is a smart move to secure the long-term success of your diversified portfolio.
FAQs
How do I choose markets that balance each other’s seasonality?
To keep occupancy steady throughout the year, target markets with opposite peak and low seasons. By diversifying your portfolio across locations with different demand cycles, you can minimize seasonal dips. Additionally, listing your properties on multiple platforms can help smooth out fluctuations, ensuring a more reliable revenue stream even during slower months.
What local short-term rental rules should I verify before buying?
Before purchasing a short-term rental property, it’s crucial to understand the local rules and regulations. These can include registration requirements, transient occupancy taxes, limits on rental days, zoning laws, or even outright bans. Since these laws differ by city and state, they can significantly affect both the profitability and legality of your investment.
Make sure to check for any licensing requirements, renewal processes, or restrictions imposed by homeowners’ associations (HOAs). Doing your homework is key – whether that means diving into local ordinances yourself or consulting experienced property managers who are familiar with the area. Choosing a market with regulations that support short-term rentals can set you up for long-term success.
What’s the best way to manage pricing and operations across multiple cities?
To effectively manage pricing and operations across multiple cities, consider using a multi-platform strategy. This approach helps broaden your reach and minimizes dependence on any single channel. Partnering with a professional vacation rental management company, such as Rank One Stays, can make the process much smoother. They handle key tasks like dynamic pricing, optimizing listings, guest support, and cleaning services. This not only maintains high standards but also adjusts pricing to local market trends, keeping your properties competitive and profitable in various locations.