

Buying an STR without data is a fast way to overpay. With more than 1.5 million U.S. short-term rental listings, I’d use market tools to check occupancy rate, ADR, projected revenue, seasonality, supply growth, and local rules before I look at any deal too seriously.
Here’s the short version: the 8 tools in this article do 3 different jobs:
- Market screening: AirDNA, AllTheRooms, PriceLabs Market Dashboard
- Deal analysis: Mashvisor, Airbtics, Rabbu
- Pricing and comp tracking: Transparent, Wheelhouse
I’d also keep one rule in mind: don’t trust one data source by itself. In thin markets, automated estimates can miss by 15% to 25%. So I’d compare at least two platforms, then check live Airbnb calendars by hand.
What each tool is best for:
- AirDNA – broad market research and block-level trend checks
- Mashvisor – property math, including cap rate, cash-on-cash return, and STR vs. long-term rental comparisons
- Airbtics – hyper-local analysis with custom map areas and address-level deal math
- Rabbu – free first-pass screening for single addresses
- AllTheRooms Analytics – long history, cross-platform data, and cycle checks
- Transparent – portfolio benchmarking and live rate shopping
- PriceLabs Market Dashboard – market trends plus pricing signals like lead time and booking pace
- Wheelhouse – demand forecasts and pricing-focused comp sets
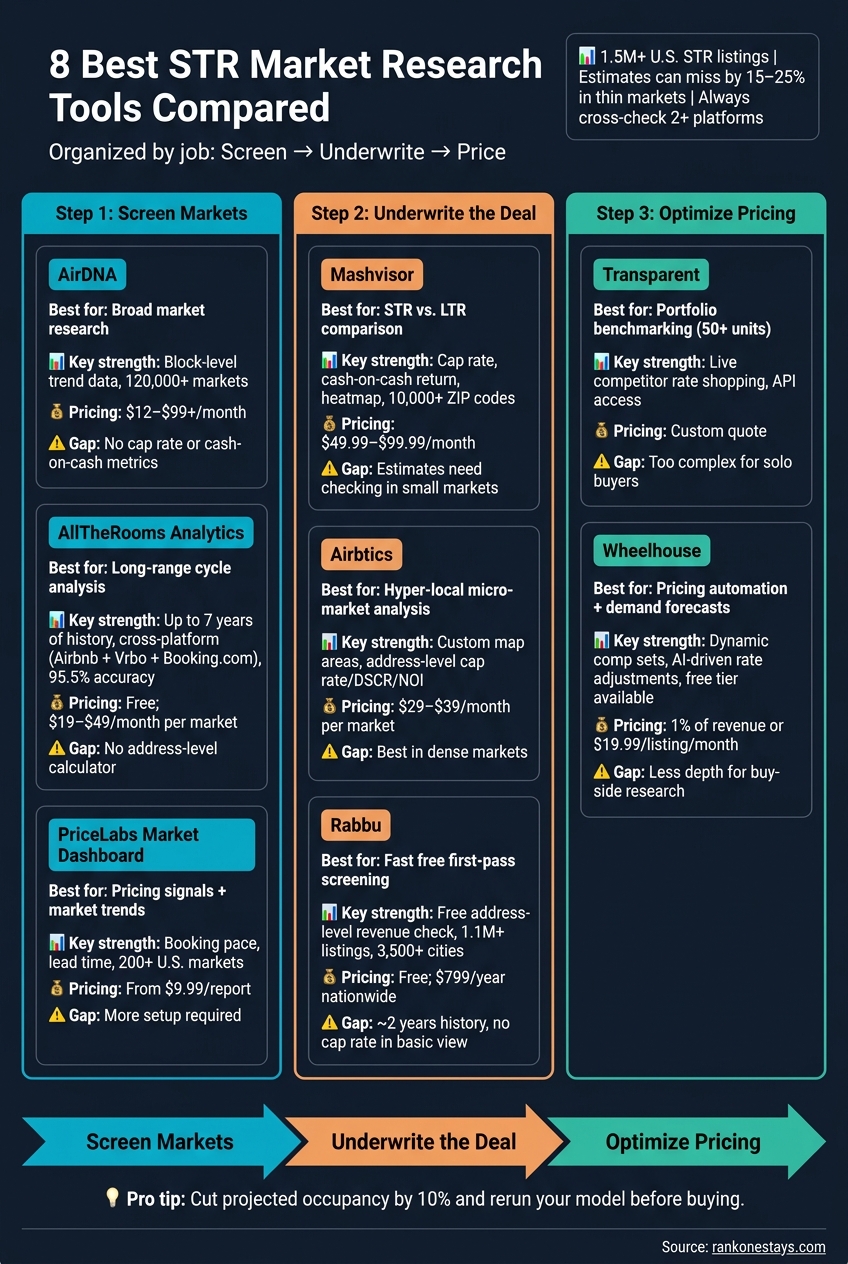
8 Best STR Market Research Tools Compared (2026)
How to Find Profitable Short Term Rental Markets Before They’re Saturated (Data Tool Walkthrough)
sbb-itb-103bddb
Quick Comparison
| Tool | Best Use | Main Strength | Main Limitation | Best For |
|---|---|---|---|---|
| AirDNA | Market screening | Deep market and neighborhood data | No built-in investor return metrics | Buyers narrowing markets |
| Mashvisor | Deal analysis | STR/LTR comparison and return metrics | Estimates need checking in small markets | Investors underwriting purchases |
| Airbtics | Micro-market analysis | Custom map areas and address-level metrics | Better in dense markets | Buyers focused on one pocket or block |
| Rabbu | Fast screening | Free address-level revenue check | Lighter history and fewer built-in deal metrics | Early-stage deal filtering |
| AllTheRooms | Long-range market review | Up to 7 years of cross-platform data | No address-level calculator | Market trend analysis |
| Transparent | Portfolio benchmarking | Live competitor pricing and API use | Too much for most solo buyers | Large operators |
| PriceLabs Market Dashboard | Pricing + market checks | Booking pace, lead time, comp filters | More setup than some buyers want | Active hosts and investors |
| Wheelhouse | Pricing support | Demand forecasts and custom comp sets | Less depth for buy-side research | Hosts scaling listings |
My takeaway: if I were buying today, on July 3, 2026, I’d use AirDNA or AllTheRooms to screen markets, Mashvisor or Airbtics to test the deal, and PriceLabs or Wheelhouse once the property is live. That gives me a cleaner view of demand, price strength, and downside risk before I spend real money.
What to Look for in an STR Market Research Tool
Analytics tools do two things: they help you screen markets and estimate what a property might earn.
The best ones give you both a market-level dashboard and address-level revenue estimates. Focus on the metrics that tell you how a market is actually performing: occupancy, ADR, RevPAR, supply growth, and active listing counts. [8][5]
Local detail matters more than many investors think. A city can look average on paper while a few ZIP codes, neighborhoods, or even single blocks do much better.
Regulation signals are non-negotiable. A market may look good at first glance, but it’s still a weak buy if local STR rules block operations or put tight limits on them. Look for tools that surface local rules with plain-language summaries or investor-friendliness ratings. [8][10]
Before you trust any forecast, check the data. Small markets can swing hard, and some tools overstate occupancy by counting blocked dates. That’s why it’s smart to cross-check at least two platforms before making a six-figure purchase. [8][5]
Use these filters to judge the tools below.
1. AirDNA
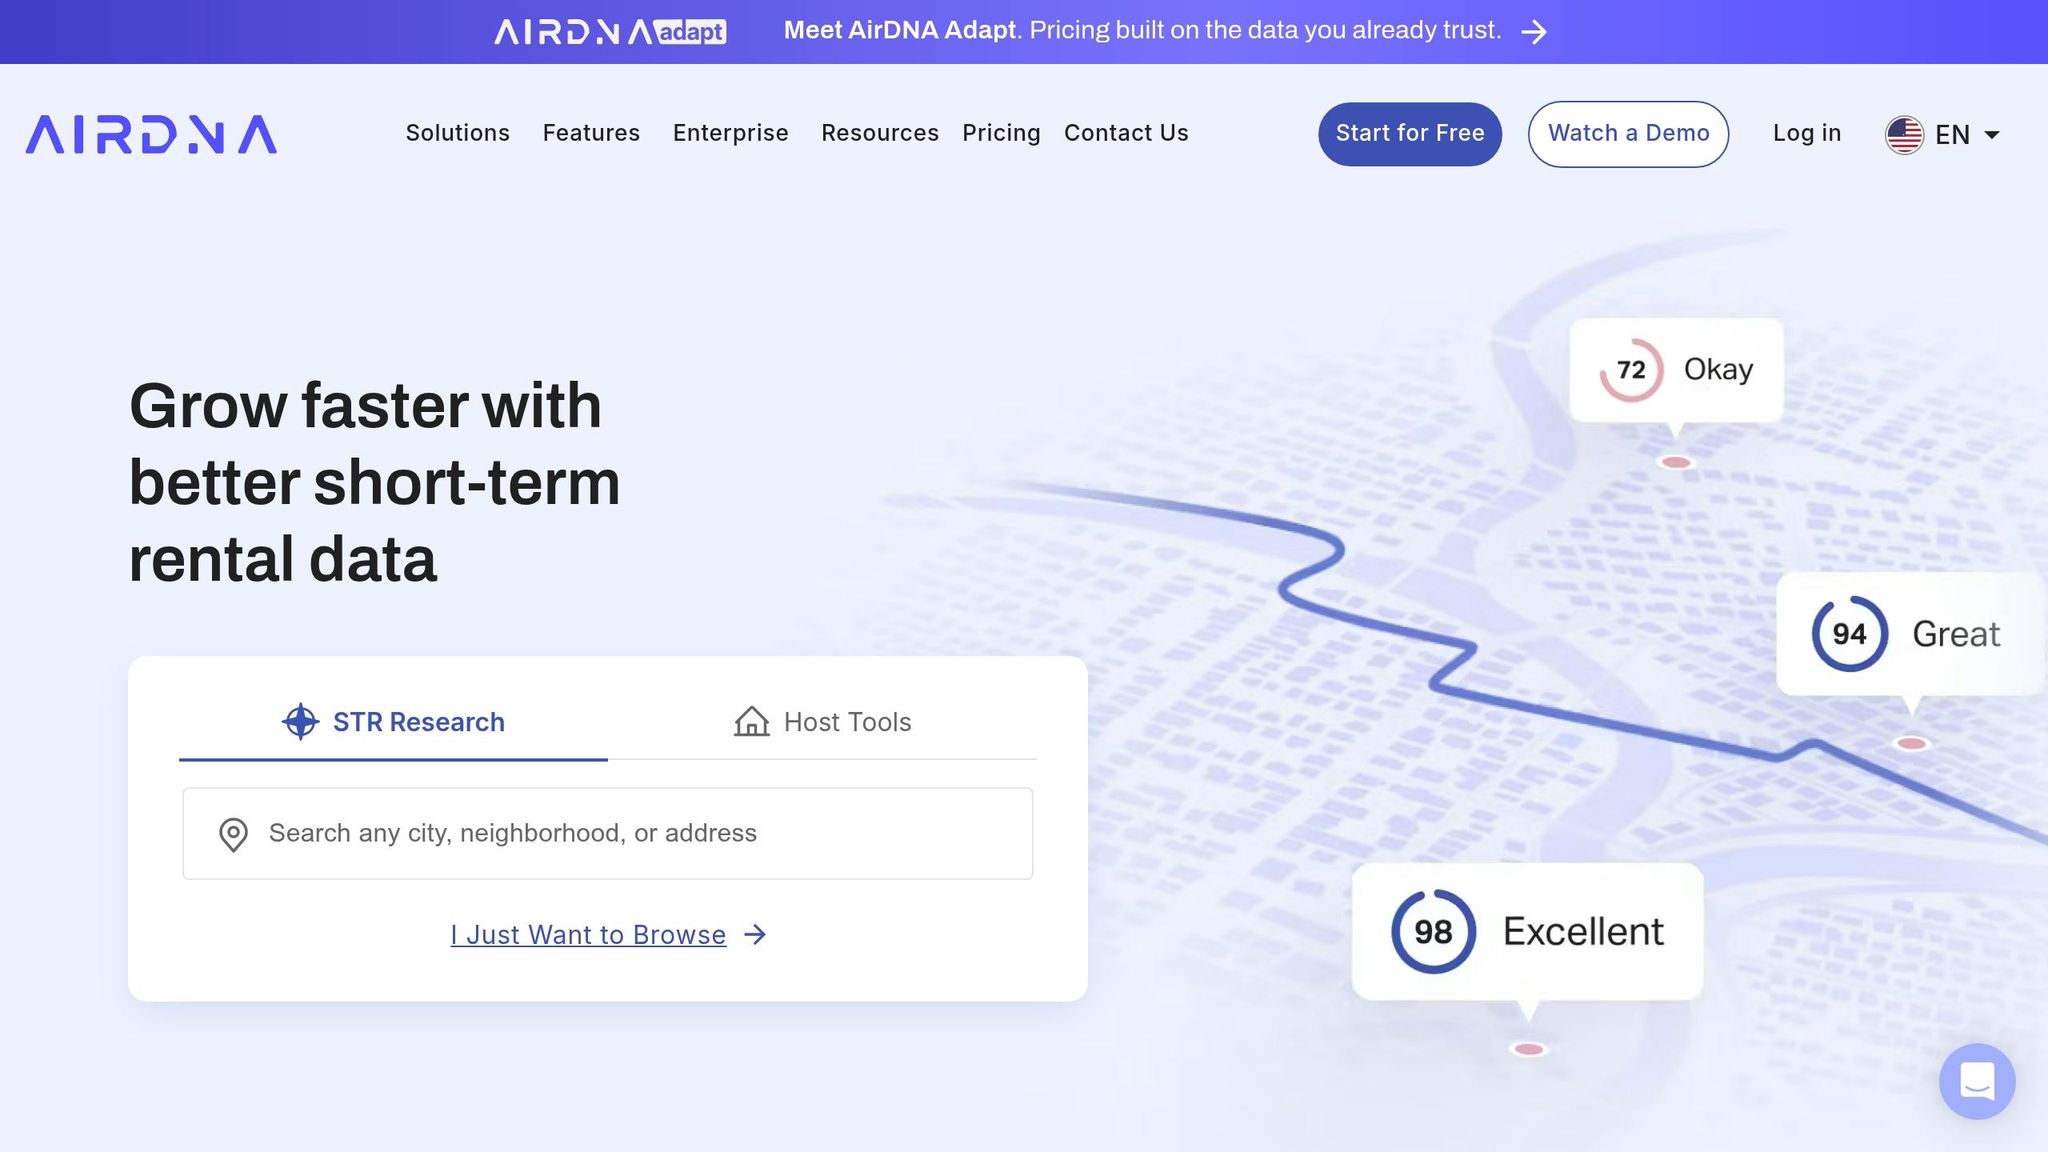
AirDNA is a strong STR market-screening tool, with historical data going back to 2015 [1].
Occupancy and Revenue Depth
The platform tracks occupancy and revenue trends at a very detailed level. Its Rentalizer tool gives property-level revenue estimates, which is handy when you’re sizing up a deal fast. In thinner markets, though, it’s smart to double-check Rentalizer with manual Airbnb searches or a second data source [5].
Neighborhood or Property-Level Underwriting
AirDNA gives you data at the market, ZIP code, neighborhood, and even block level [1]. That matters more than it may seem. A market can look just okay on the surface, while a few small pockets are doing much better than the headline numbers suggest.
It also lets users browse U.S. for-sale properties from MLS listings alongside projected STR performance data [9]. That can save time when you’re moving from market research into actual deal review.
Seasonality and Pricing Intelligence
Its 12-month forecasts can help investors spot seasonal slowdowns before buying [1][5]. That’s useful if a market looks strong in peak season but gets soft for part of the year.
Best Fit for U.S. Investors
The Market Score is a quick way to flag markets that deserve a closer look [9]. That said, AirDNA has a gap: it doesn’t natively calculate investor metrics like cap rate, DSCR, or cash-on-cash return [7]. So if you’re doing deal math, you’ll need to run those numbers on your own.
Pricing starts at about $12 to $19 per month for small markets and goes up to $99+ per month for markets with 1,000 or more listings [3][5].
| Feature | AirDNA Capability |
|---|---|
| Granularity | Market, ZIP code, neighborhood, and block level [1] |
| U.S. MLS Integration | Yes – browse for-sale properties with STR projections [9] |
| Investor Metrics (Cap Rate, DSCR, Cash-on-Cash Return) | Not included [7] |
If you want market data and then need cleaner deal-level math, the next tool adds that extra layer.
2. Mashvisor
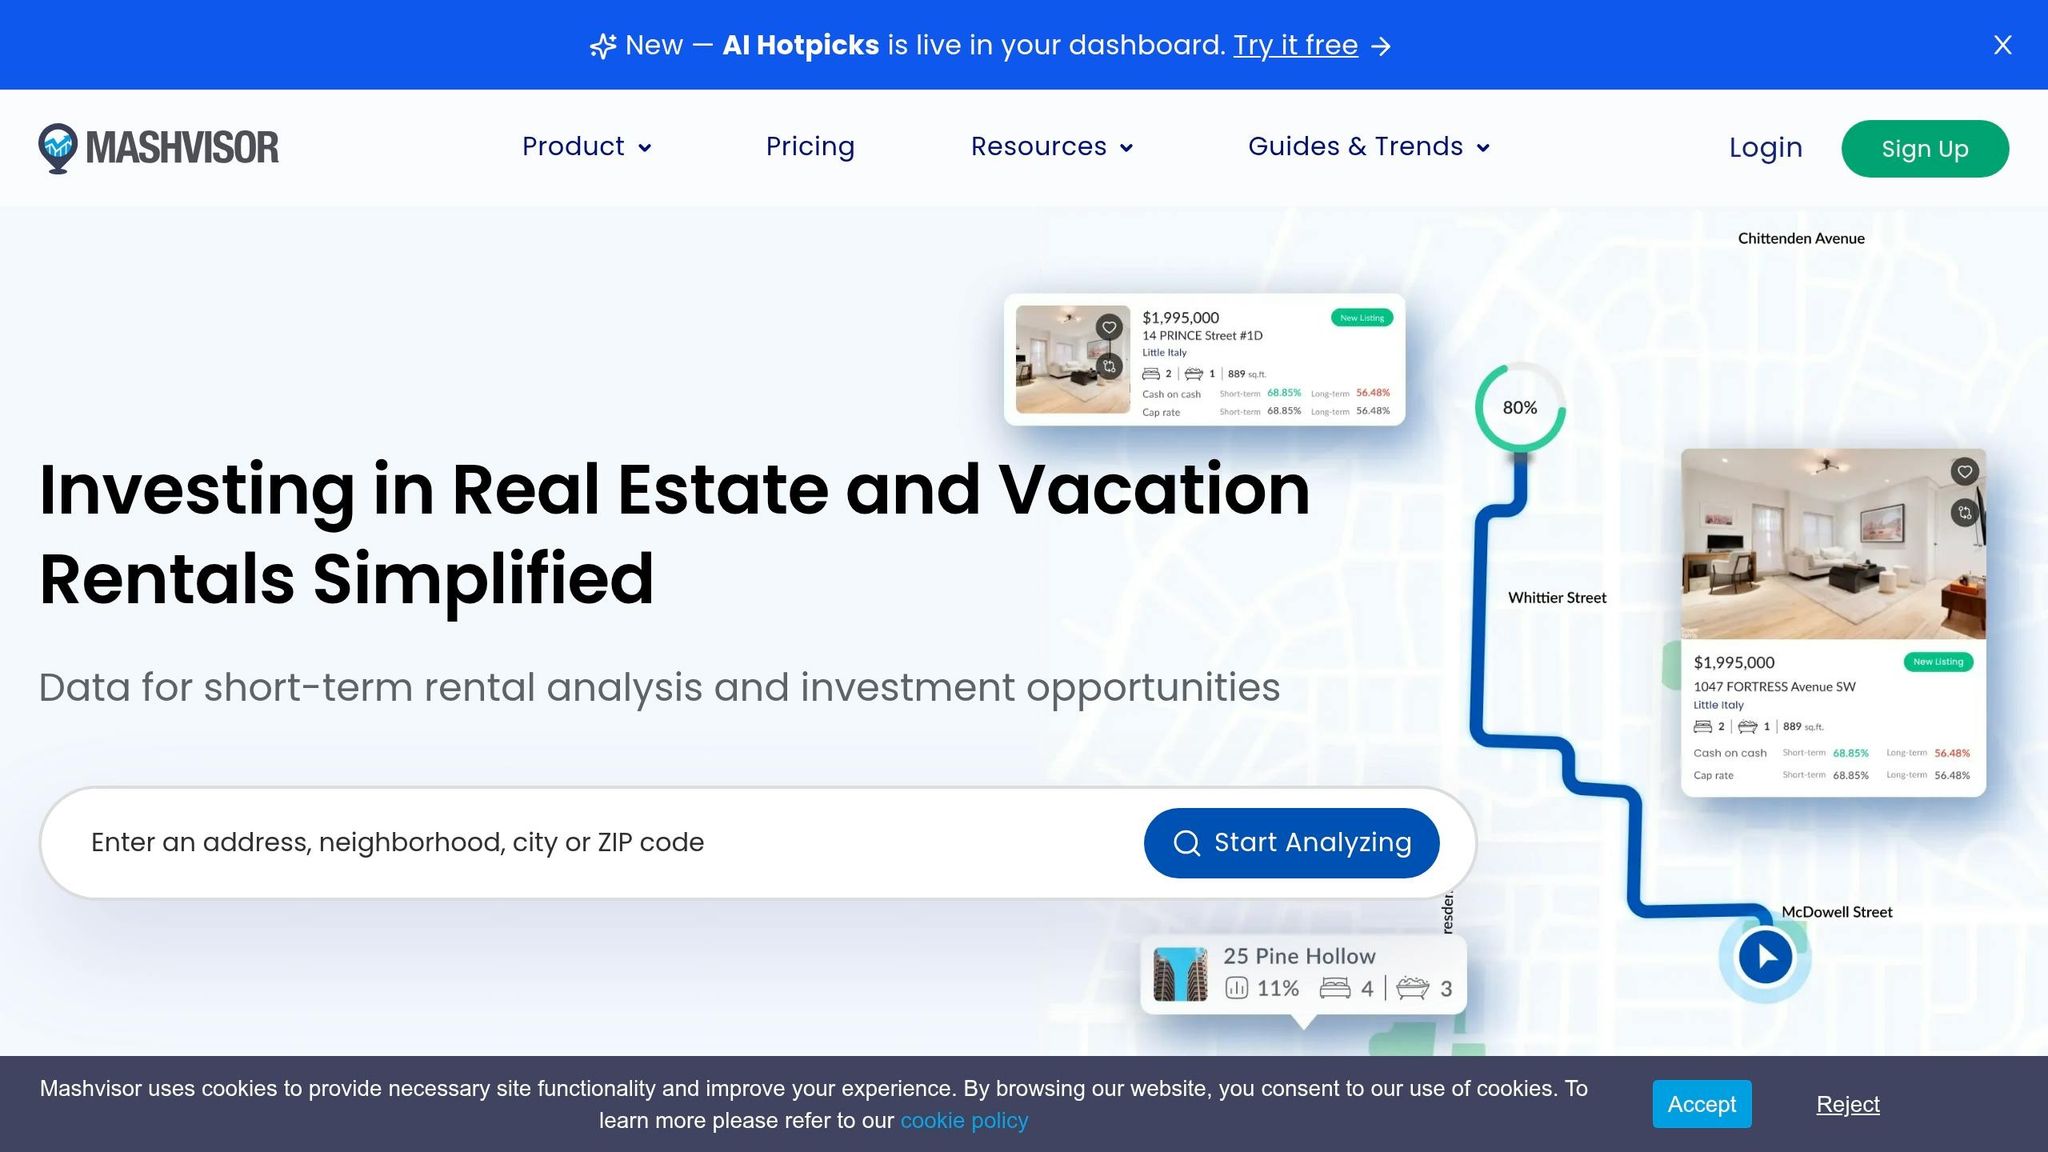
Mashvisor is built for acquisition analysis. It helps investors figure out whether a specific property makes more sense as an STR or an LTR. Put simply: if AirDNA helps you screen markets, Mashvisor helps you underwrite the deal.
Occupancy, ADR, and Revenue Depth
Mashvisor tracks occupancy, ADR, RevPAR, and revenue at the city, ZIP code, neighborhood, and property levels [12][4]. Its Airbnb Calculator produces property-level estimates based on rental comps from similar nearby listings [13]. It covers all 50 states and more than 10,000 ZIP codes [4], and includes up to 36 months of historical Airbnb performance data to support forecasting [12].
In smaller markets, comp data can dry up fast. So treat these projections as directional, not absolute.
Neighborhood or Property-Level Underwriting
This is where Mashvisor stands out. Its Heatmap tool uses color coding to show neighborhoods by occupancy, cap rate, cash-on-cash return, and rental income, which makes it easier to spot stronger submarkets before digging into individual listings [6][13]. That can save a lot of time early in the search. Mashmeter also scores neighborhood potential using current and historical data [6][13].
At the property level, the Airbnb Calculator pulls together the numbers most investors care about:
- Listing price
- Startup costs
- Rental income
- Recurring operating expenses
- Cash flow
- Occupancy rate
- Cap rate
- Cash-on-cash return
- Down payment
- Monthly mortgage payments [13]
Seasonality and Pricing Intelligence
Mashvisor surfaces seasonality, saturation, and supply-demand shifts. Its dynamic pricing tools also adjust nightly rates based on market conditions [4][11].
U.S. Market and Investor Workflow Fit
Mashvisor is built around acquisition analysis. Its STR vs. LTR comparison gives you a side-by-side look at which route is more profitable for a given property [12][14].
Pricing starts at $49.99/month for Lite on an annual plan, then $74.99/month for Standard and $99.99/month for Professional. API access starts at $129/month [14].
| Feature | Mashvisor Capability |
|---|---|
| Geographic Levels | City, ZIP Code, Neighborhood, Street Address [12] |
| STR Metrics | Occupancy, ADR, RevPAR, Monthly/Annual Revenue [12][4] |
| Investment Metrics | Cap Rate, Cash-on-Cash Return, Cash Flow [12][4] |
| LTR Comparison | Yes – side-by-side STR vs. traditional rental [12] |
| Update Frequency | Weekly (STR), multiple times per day (MLS) [12][4] |
It’s smart to cross-check Mashvisor’s revenue and occupancy assumptions with at least one other source before moving on a deal, especially in smaller, rural, or secondary markets. The next tool takes a different approach to STR data.
3. Airbtics
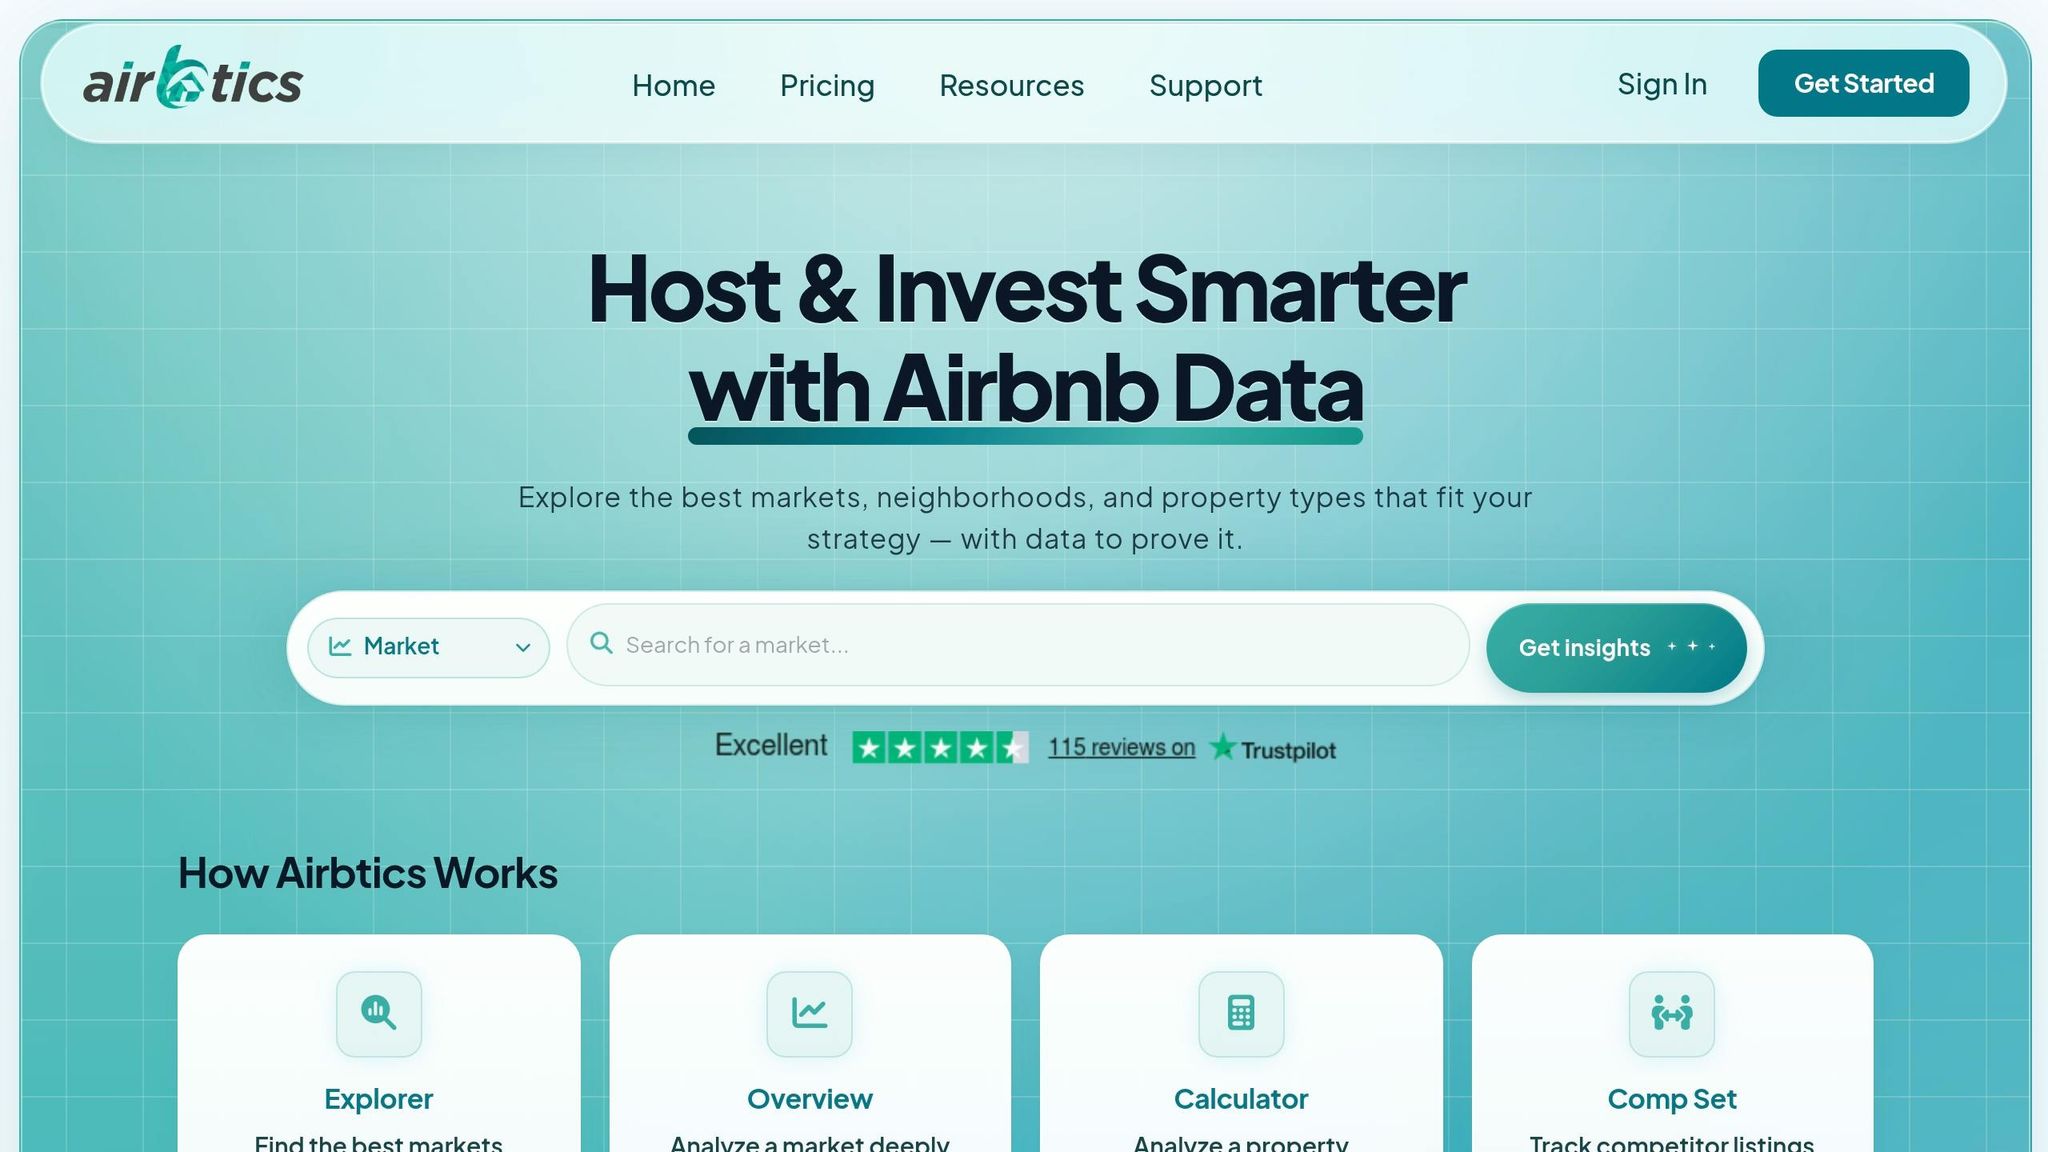
Airbtics is built for hyper-local STR data. Its main strength is simple: it helps you study neighborhoods and micro-markets with more precision, instead of leaning on citywide averages that can blur what’s happening on the ground.
Occupancy, ADR, and Revenue Depth
Airbtics tracks millions of listings worldwide. For U.S. investors, it provides occupancy, ADR, RevPAR, and revenue estimates down to the neighborhood and block level [1][16]. That level of detail can make a big difference when one part of a city performs very differently from the next.
Data refreshes daily on top tiers and weekly on entry plans [15]. That gives users a better read on long-term growth trends and seasonal changes without waiting around for stale numbers.
Neighborhood or Property-Level Underwriting
If Mashvisor helps you size up a deal, Airbtics helps you define the exact market you want to analyze.
Instead of sticking with preset market boundaries, investors can draw custom search areas on a map [17][19]. That matters when the neighborhood you care about doesn’t line up neatly with ZIP codes or city averages. In STR investing, that happens all the time.
At the property level, the built-in Airbnb calculator lets users enter a specific address or Airbnb URL. It then returns revenue, cap rate, cash-on-cash return, NOI, and DSCR [16][17]. Users can also model expenses such as:
- Mortgage payments
- Taxes
- Management fees
- Startup costs [17]
Airbtics also includes "Amenities Insights", which shows which features tend to lift occupancy and ADR in a given area [16]. The Guest Origin layer adds another useful angle by showing where travelers are coming from [17].
Seasonality and Pricing Intelligence
Airbtics includes 12 months of projected pricing along with booking-window trends [17][19]. That can help investors see when demand tends to build, when rates soften, and how far ahead guests usually book.
U.S. Market and Investor Workflow Fit
Airbtics works best in dense markets where there are enough comps to support dependable analysis [15]. It fits investors who want to test a specific sub-market before moving forward on a deal.
Another plus: API access is included in mid-tier plans, which makes it easier to pull the data into custom financial models [15].
Pricing starts at about $29–$39 per month for a single market, with multi-market plans and higher tiers available [15][18]. New users can also access a free trial [19].
| Feature | Airbtics Capability |
|---|---|
| Historical Depth | 24–36 months depending on market and plan [15][1] |
| Data Refresh | Daily on top tiers; weekly on entry-level tiers [15] |
| Geographic Granularity | Neighborhood/block level [1] |
| Custom Market Boundaries | Yes – draw your own search area [17][19] |
| Investment Calculators | Cap Rate, Cash-on-Cash, NOI, DSCR, ROI [16][17] |
| API Access | Included in mid-tier plans [15] |
One caution: discount new-listing projections to account for ramp-up time [15]. A new property rarely performs at full pace right out of the gate.
4. Rabbu
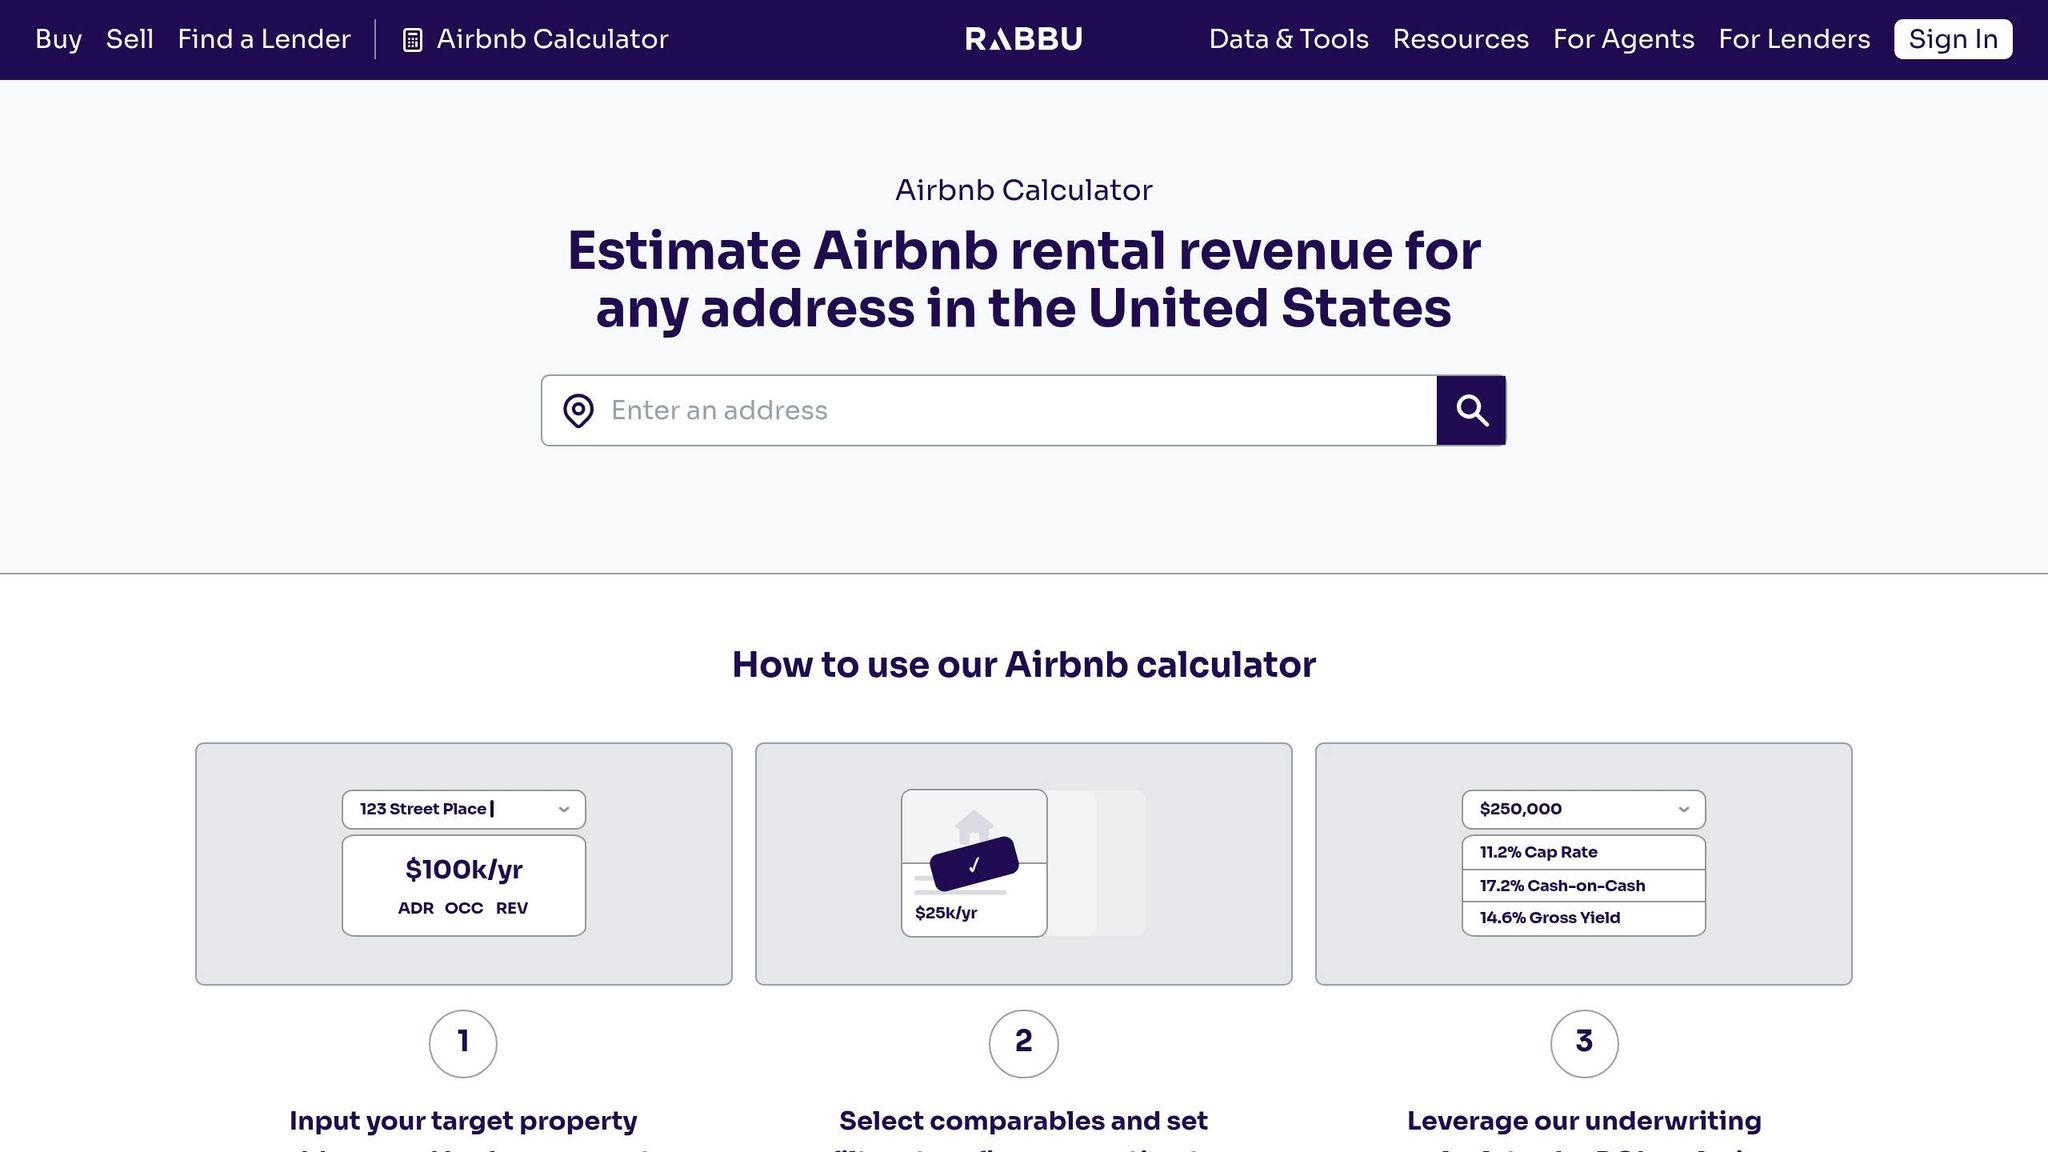
Rabbu is built for fast screening. If you look at several addresses each week, it gives you a quick revenue estimate, and the core calculator is free [20][5]. That makes it handy when you want to rule out weak markets before you spend time on deeper analysis.
Occupancy, ADR, and Revenue Depth
Rabbu tracks data from more than 1.1 million active Airbnb listings across the U.S. and covers over 3,500 cities [24]. Its main metrics are ADR, occupancy rate, and RevPAN (Revenue Per Available Night), which rolls pricing and occupancy into a single number [21]. Rabbu puts the average U.S. occupancy rate at 39% and the average ADR at $358 [24].
The tradeoff is depth. Historical coverage is only about 2+ years, and most addresses update quarterly, though high-volume metro areas get more frequent refreshes [23][22].
Neighborhood or Property-Level Underwriting
You enter an address, then manually include or exclude comps and add costs like mortgage, taxes, cleaning, and management [21][5]. Rabbu doesn’t show cap rate or cash-on-cash return in the basic view, so you’ll need to calculate those yourself [21].
That matters in thinner suburban markets. When there are fewer than 200 active comps, one outlier listing can swing the revenue estimate by as much as 30% [22]. For that reason, many investors apply a haircut to Rabbu’s estimate before final underwriting [20].
Seasonality and Pricing Intelligence
Rabbu shows monthly revenue, ADR, and occupancy, so it’s easy to spot busy seasons and slower stretches [5][24].
U.S. Market and Investor Workflow Fit
Rabbu is a U.S.-only platform built for pre-purchase screening [5][22]. Think of it as a first-pass filter, not a full underwriting system. It’s not meant for day-to-day operating insight or dynamic pricing. Use it to narrow the field, then move into deeper underwriting once a deal looks promising.
| Feature | Rabbu Capability |
|---|---|
| Key Metrics | ADR, Occupancy, RevPAN |
| Data Refresh | Quarterly (standard); more frequent in major metros [22] |
| Historical Depth | ~2+ years [23] |
| Geographic Scope | U.S. only |
| Investment Calculators | Expense calculator (mortgage, taxes, cleaning, management) [5] |
| Pricing | Free for most users; about $799/year for nationwide access [20][21] |
Rabbu is also a sales funnel for its brokerage and property management services [22]. That doesn’t make the data useless. It just means you should get a second opinion before making a decision.
If you want broader market coverage and deeper analytics after a quick screen, the next platform goes further.
5. AllTheRooms Analytics
After fast screening tools, AllTheRooms is a better fit for deeper historical market checks.
It offers the deepest history on this list, with up to seven years of data for cycle analysis [25].
Occupancy, ADR, and Revenue Depth
AllTheRooms pulls data from Airbnb, Vrbo, and Booking.com, which gives you a broader view of the market [25][5]. It also holds six U.S. patents for deduplicating listings across those platforms and says it delivers a 95.5% accuracy rate [25].
On top of that, the platform includes six months of forward-looking occupancy and revenue projections [25][5]. That mix of long history and short-term forecasts helps when you’re trying to read where a market has been and where it may be heading next.
Neighborhood or Property-Level Underwriting
This platform is best for long-range market analysis, not address-level underwriting.
With Market Explorer, you can filter by area name or ZIP code and review occupancy, ADR, supply, revenue, and average stay length [25][27]. But it does not come with an address-level revenue calculator [25][27].
So if you’re trying to pressure-test one exact property, this isn’t the tool for that part of the job.
Seasonality and Pricing Intelligence
The seven-year lookback window paired with a six-month forward view makes AllTheRooms useful for spotting demand cycles and near-term market shifts before you buy [25][5].
That matters because short-term rental markets can change fast. A market that looks strong in one season can tell a very different story when you zoom out.
U.S. Market and Investor Workflow Fit
AllTheRooms works best as a market-level screening tool for investors who want cross-platform supply data and long-range trend analysis before moving into deal-level underwriting [25].
The free plan includes:
- Three months of historical data
- The current month of forward data
- Up to five tracked competitors
- No credit card required [25]
Paid plans start at about $19 per market per month, while Pro plans start at about $49 per market per month [25][5].
| Feature | AllTheRooms Capability |
|---|---|
| Historical Data | Up to 7 years [25] |
| Forward Projections | 6 months [25][5] |
| Address-Level Calculator | No [25] |
| Granularity | City, ZIP code, and neighborhood [26][27] |
| Deduplication Accuracy | 95.5% [25] |
| Platforms Tracked | Airbnb, Vrbo, Booking.com [25][5] |
| Pricing | Free; Basic starts at about $19/month per market; Pro starts at about $49/month per market [25][5] |
If you need address-level underwriting, move to the next platform.
6. Transparent
If you need operator-grade benchmarking after market screening, Transparent is the next step.
Transparent, now part of Lighthouse, is built for institutional operators and large STR portfolios.
Occupancy, ADR, and Market Trends
Transparent tracks occupancy, ADR, and market trends for operator-level benchmarking [28]. Its reliability score is 9/10, which points to mature infrastructure [28].
Property-Level Underwriting
It benchmarks competitors by property type, bedroom count, and date range [28]. For larger operators, API access lets them feed that data straight into proprietary underwriting models [28].
Pricing and Seasonality
Its standout feature is rate shopping, which shows how competitors are pricing in real time [28]. That can make pricing pressure in a market much easier to spot before you commit.
Who It Fits Best
Transparent is best suited for institutional investors and large-scale property management companies with 50+ units [5]. Pricing is custom quoted [28]. For a solo investor, it’s usually more platform than you need.
If you want market data in a simpler investor dashboard, the next tool is built for that.
7. PriceLabs Market Dashboard
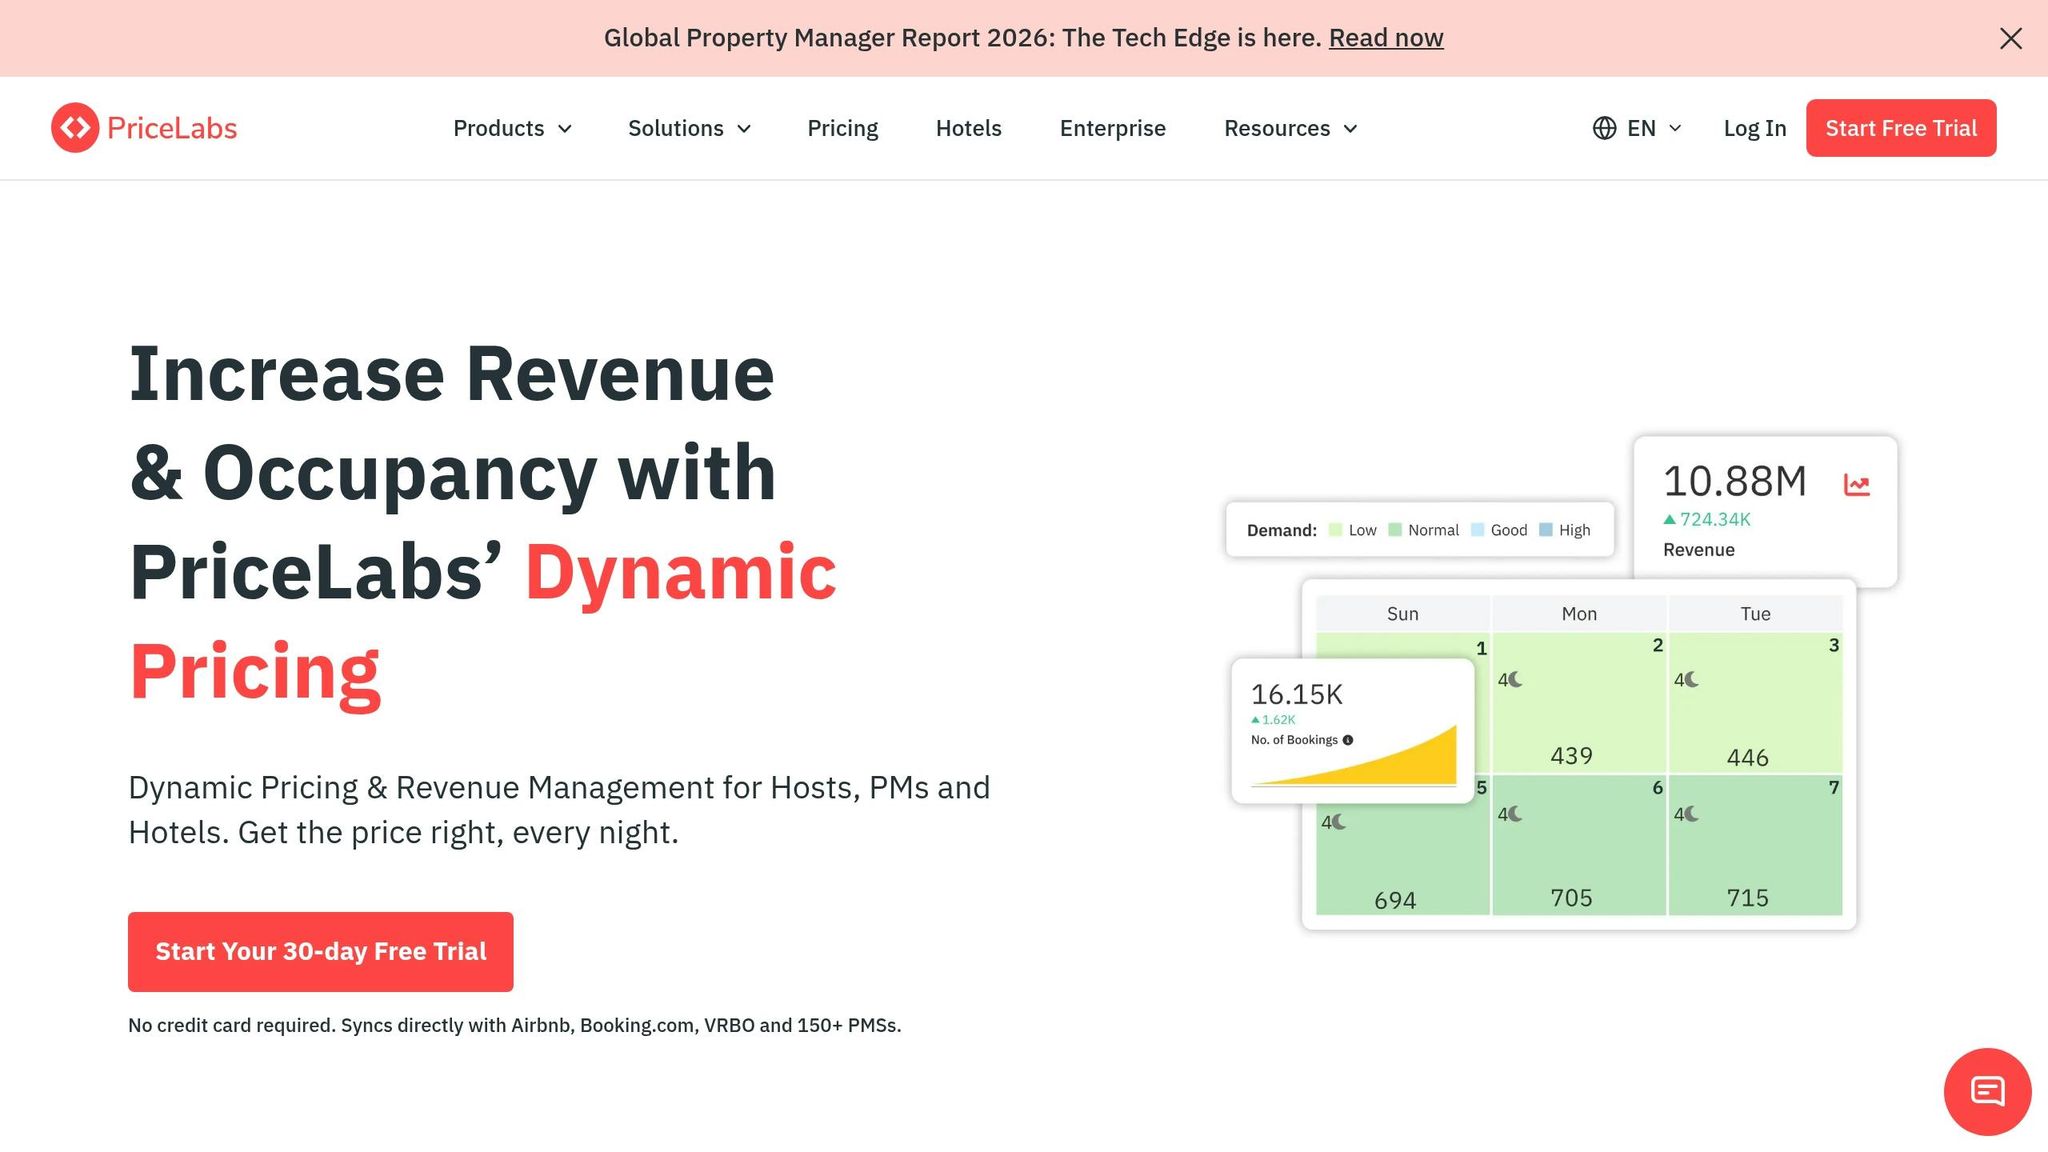
For investors who want something lighter and more flexible than Transparent, PriceLabs brings market screening and pricing into one place.
Most people know PriceLabs for dynamic pricing. But its Market Dashboard also helps investors screen markets and underwrite deals. The main draw is simple: it helps you see whether a market has enough demand, booking pace, and pricing power to support a purchase.
Occupancy, ADR, and Revenue Depth
The dashboard tracks the core numbers, including ADR, occupancy rate, RevPAR, and total annual revenue [30]. It includes two years of historical data and one year of forward-looking projections, with daily updates from Airbnb and Vrbo [30].
That gives investors a quick read on market health without bouncing between tools.
Neighborhood or Property-Level Underwriting
For a tighter read, PriceLabs lets you draw a custom area on a map or zoom into a 0.6-mile radius to check neighborhood-level performance [29][30]. You can also build up to 30 custom Comp Sets and filter by 40+ variables, including bedroom count, amenities, and guest ratings [30][34].
That matters when a market looks good on paper, but one pocket of it performs very differently from the rest.
Seasonality and Pricing Intelligence
PriceLabs shows booking pace, lead time, and stay length against historical norms [30]. It also flags upcoming demand spikes through "Key Future Dates" [36].
If pacing is moving faster than normal, that can support stronger underwriting [33]. And if you study the top 10% of earners in your target market, you may spot an amenity gap. Features like hot tubs, EV chargers, or dedicated workspaces can help support higher ADR [32].
U.S. Market and Investor Workflow Fit
PriceLabs includes ready-to-view dashboards for 200+ popular short-term rental markets in the U.S. [31]. Reports export cleanly as PDFs or CSVs, which makes them easy to use in internal reviews and planning talks [30].
Pricing starts at $9.99 for a 1,000-listing report, and quick address-based estimates through Revenue Estimator Pro start at $2.50 [30].
PriceLabs works well for investors who want market research and pricing automation in the same tool. The tradeoff is that extra customization can make it harder to use at first [29][35].
8. Wheelhouse
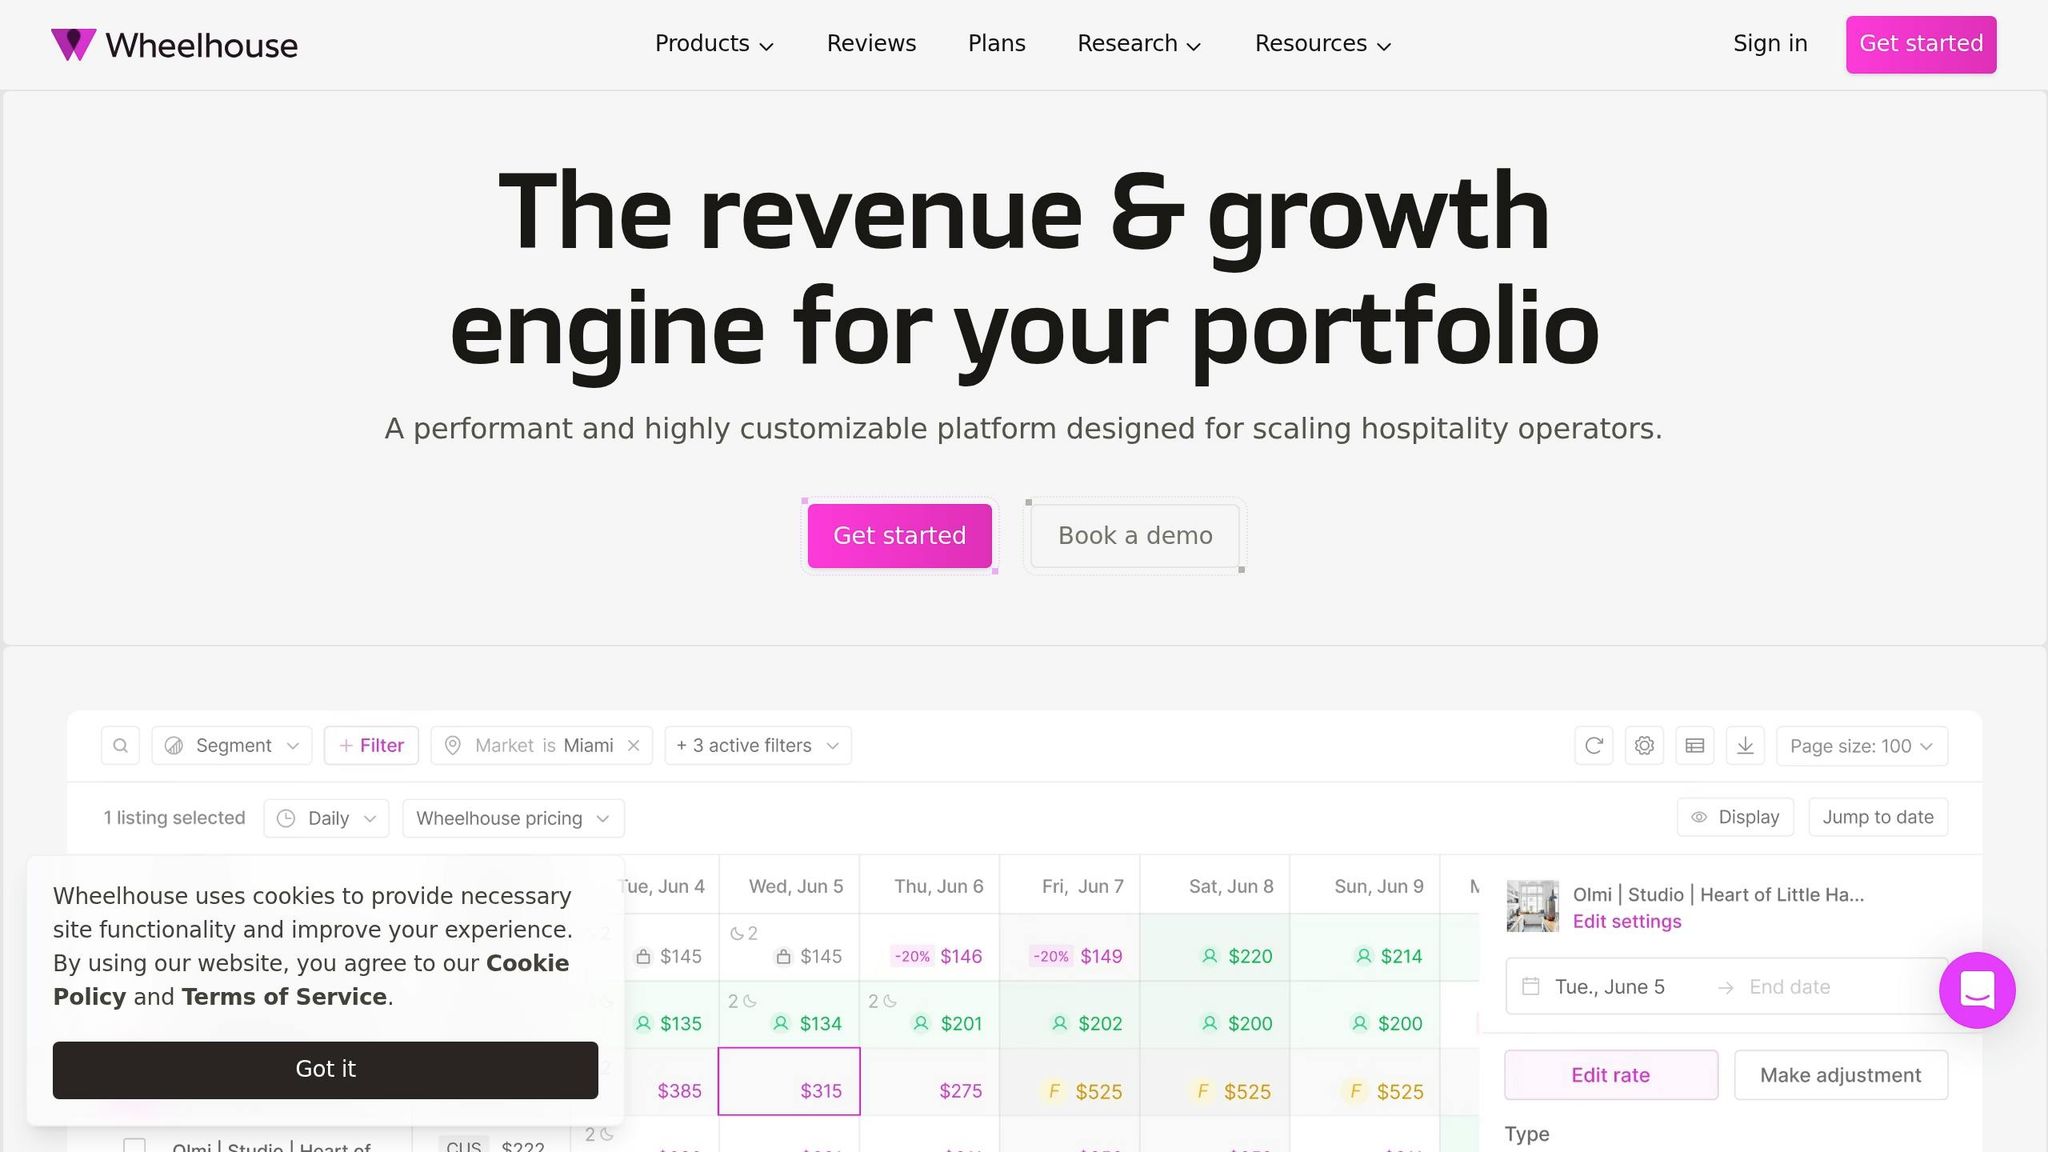
If you want pricing automation and market signals, Wheelhouse is a solid next step. It’s a pricing tool first, but it also gives investors useful market data. In practice, it tends to work best once a market is already on your shortlist.
Occupancy, ADR, and Revenue Depth
Wheelhouse shows multi-year trend data and 12+ months of demand forecasts, which can help you check seasonality before buying [37].
Neighborhood or Property-Level Underwriting
Wheelhouse’s "Dynamic Sets" feature lets you build custom comp sets around top-performing listings in a target area [37]. That makes it easier to test whether a potential acquisition has a shot at beating local comps before you commit.
Seasonality and Pricing Intelligence
Wheelhouse flags supply shortages and surge demand, which helps investors read shifts in inventory and booking pressure [37]. If you use Wheelhouse, turn off Airbnb Smart Pricing so you don’t end up with conflicting rates [37].
U.S. Market and Investor Workflow Fit
Wheelhouse offers a free tier that lets you connect listings, view market reports, and test settings before paying anything [37]. Paid plans start at 1% of booking revenue with a minimum of $2.99/listing/month for the Pro Flex plan, or $19.99/listing/month for Pro Flat. That drops to $16.99/listing/month for portfolios with 10–49 listings [37].
Wheelhouse fits investors who want pricing automation with basic market visibility. It’s less detailed than deeper research platforms, so some operators still adjust rates by hand during peak demand [37].
Next, compare the eight platforms side by side.
Side-by-Side Comparison of the 8 STR Analytics Platforms
No single tool handles every step. This table pulls the earlier reviews into one decision guide.
These platforms generally fit into three jobs: market screening, deal underwriting, and pricing optimization.
| Tool | Best For | Core Metrics | Geographic Strength | Ideal Investing Use Case |
|---|---|---|---|---|
| AirDNA | Broad market screening | RevPAR, ADR, Occupancy, seasonality, comps | Global (120,000+ markets) [1] | Buy-side acquisition screening |
| Mashvisor | STR vs. LTR strategy comparison | Cap Rate, Cash-on-Cash, ADR, Occupancy | U.S.-only (400+ metro areas, 10,000+ zip codes) [4] | Deciding between buy-and-hold and short-term rental |
| Airbtics | Neighborhood-level analysis | Neighborhood occupancy, ADR, RevPAR, micro-market trends | Global | Finding undervalued micro-markets |
| Rabbu | Quick property underwriting | Revenue projections, RevPAN, comps | U.S.-only | Free first-pass deal screening |
| AllTheRooms | Enterprise and large portfolios | Multi-platform ADR, Occupancy, regulatory data | Global | Institutional portfolio analysis |
| Transparent | Portfolio benchmarking | Daily multi-OTA supply, pacing, ADR | Global | Portfolio benchmarking and market-entry research |
| PriceLabs Market Dashboard | Dynamic pricing intelligence | Booking lead times, real-time comp sets, RevPAR | Global (200+ markets across the U.S. and Europe) [5] | Daily pricing for active operators |
| Wheelhouse | Pricing strategy and scaling | AI-driven rate adjustments, demand forecasting | Global | Professional managers scaling a portfolio |
The order here matters.
Start with screening to narrow down markets. Then move to underwriting to check whether a deal works on paper. After the listing is live, shift to pricing to improve day-to-day results.
One more thing: data tends to be stronger in dense markets. In thinner markets, it’s smart to check a second source before making a call.
Once you’ve picked the market, the next move is using that data to drive pricing and management results.
How Rank One Stays Helps Turn Market Data Into STR Results
Once you’ve picked the right market, the next part is simple to say and harder to do: execution drives the return. Rank One Stays is a full-service vacation rental management company for Airbnb and Vrbo investors.
After that, Rank One Stays takes over the day-to-day operating side. That includes listing optimization, daily pricing, 24/7 guest support, housekeeping, and damage-claim handling. If you want a turnkey setup from the start, the company also offers vacation rental interior design and staging services.
According to Rank One Stays, property owners earn 38% more revenue than the market average, and management fees start at 10%.
For investors who have already done the market research, Rank One Stays serves as the execution layer that helps turn that plan into an operating short-term rental.
Final Takeaway
The main point is simple: tools can help you screen a market, but they can’t promise a good deal. Automated STR revenue estimates can miss the mark by 15% to 25% in thin markets. And that’s more than enough to push a borderline property into bad-deal territory.
Before you buy, cross-check occupancy, ADR, RevPAR, and seasonality across at least two platforms [5]. Then validate those numbers with a manual Airbnb search so you can confirm live calendar availability in the market right now [5]. After that, cut your projected occupancy by 10% and run the model again [2].
What happens next comes down to execution. Rank One Stays can handle listing optimization, dynamic pricing, 24/7 guest support, housekeeping, and damage claims for owners who want full-service management.
FAQs
Which STR tool should I start with first?
Start with the tool that matches your goal. For broad market research on cities or ZIP codes, AirDNA is the go-to source for short-term rental data and trend tracking. If you want to compare short-term and long-term rental income side by side, Mashvisor is the better choice.
Once you’ve bought a property, Rank One Stays can help you earn more from it with listing optimization, dynamic pricing, and 24/7 guest support.
How do I verify an STR revenue estimate?
Stress-test any STR revenue estimate before you trust it.
Start by checking where the data comes from. Some platforms use scraped listing data, while others rely on integrated sources. That difference matters. Scraped data can overstate revenue by 15%–20%, which can throw off your numbers fast.
Next, make sure you’re looking at at least 12 months of data. A short snapshot can miss seasonality, local events, and slow periods. One strong month doesn’t tell you much on its own.
It also helps to tighten your comps. Don’t compare your property to just any nearby listing. Match for things like:
- Bedroom and bathroom count
- Location
- Amenities
- Property type
- Guest capacity
Once you have a more realistic gross revenue figure, convert it to NOI. That means subtracting the main operating costs, including management fees, insurance, utilities, property taxes, and maintenance reserves.
What metrics matter most in a new STR market?
Focus on ADR, occupancy rate, and RevPAN (ADR × occupancy). Those three numbers give you a clear read on how a market performs day to day.
Then look at supply growth, seasonality, and local regulations. That’s how you spot markets that are overcrowded or prone to sharp swings.
Finally, calculate cash-on-cash return and cap rate to make sure the property lines up with your financial goals. After purchase, Rank One Stays can help maximize these metrics.