
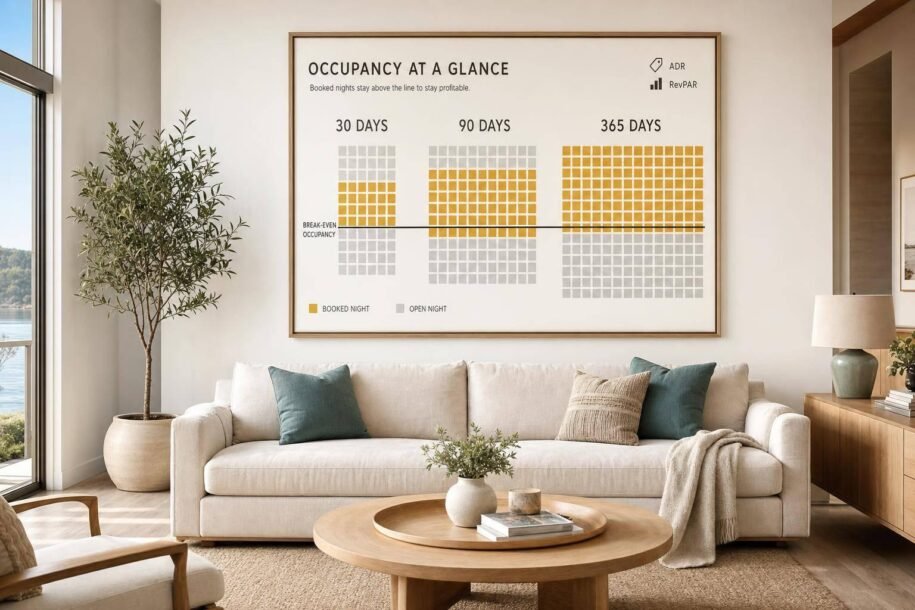
Occupancy rate only matters if it leads to profit. I’d use it to track demand, set a break-even target, compare ADR and RevPAR, and judge whether a rental is priced too low, too high, or right in line with the market.
Here’s the short version:
- Occupancy rate = booked nights ÷ available nights
- Available nights should exclude owner stays, maintenance blocks, and personal use
- RevPAR ties occupancy and pricing together, so I don’t look at occupancy by itself
- Many rentals aim for about 65% to 75% occupancy, but the right target depends on market type, season, and ADR
- A lot of short-term rentals break even around 40% to 55% occupancy
- If a place stays near 90%+ occupied, I’d check whether rates are too low
- The best way to read performance is through 30-day, 90-day, and 365-day trends, not one random month
A few numbers from the article stand out:
- Projected U.S. average occupancy for 2025–2026: 54.9%
- Example break-even: $3,000 in fixed monthly costs and $200 net per booked night = 15 nights, or 50% occupancy in a 30-night month
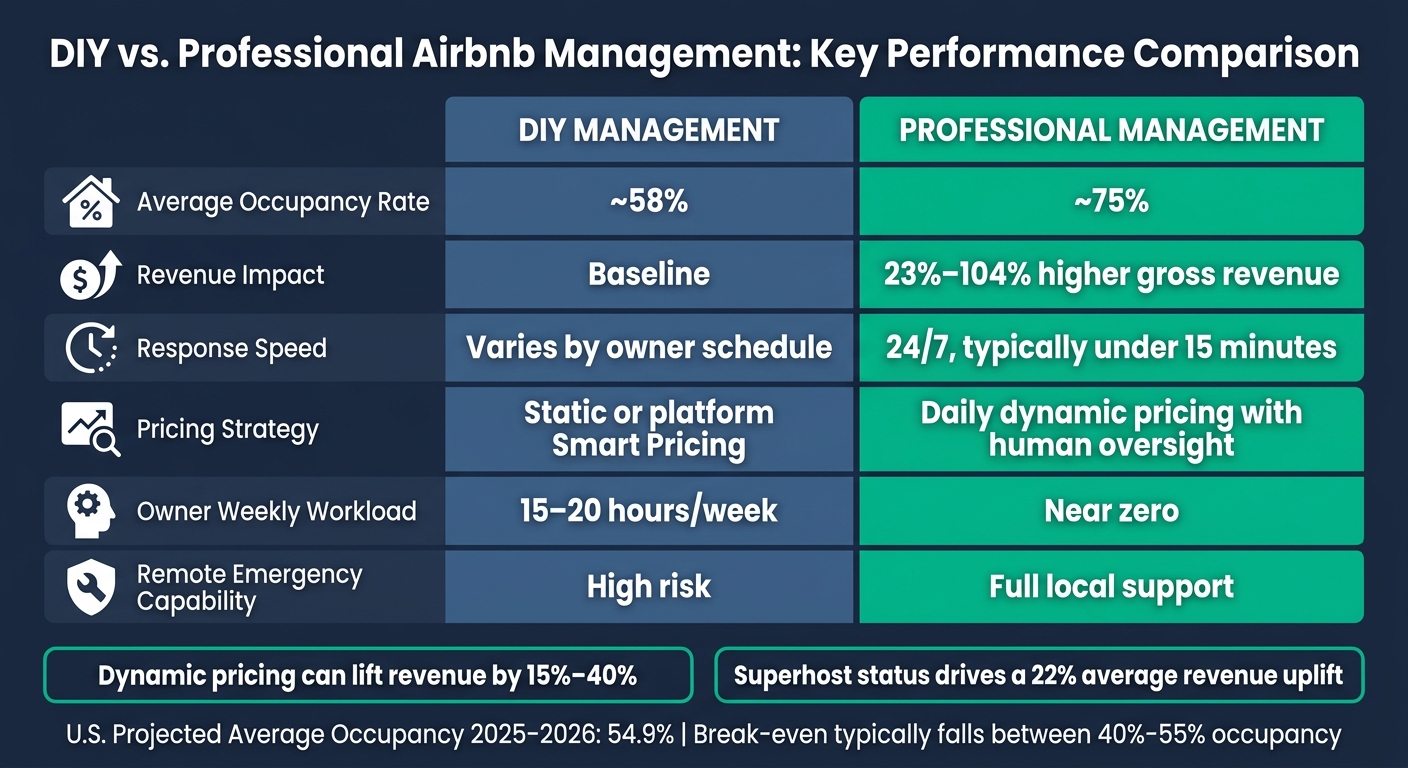
- Professionally managed listings average about 75% occupancy vs. 58% for self-managed units
- Dynamic pricing can lift revenue by 15% to 40%
- In Scottsdale, premium properties often run around 65% to 70% occupancy
If I were reviewing an Airbnb deal, I’d ask four things first: What is the break-even occupancy? How does it compare with local comps? What does seasonality do to monthly demand? And is revenue strong once ADR is factored in? That framework gets to the point fast and keeps occupancy from becoming a vanity metric.
What’s a Good Airbnb Occupancy Rate? (+ How To Improve Yours)
sbb-itb-103bddb
Occupancy Rate Basics and the Formulas Investors Use
Start with clean inputs, then run the same formulas across 30-day, 90-day, and 365-day windows. Count only nights when the listing was open for booking. Leave out owner stays, maintenance blocks, and personal use. For investors, the point isn’t just to log bookings. It’s to turn occupancy into cash-flow decisions. Next, start with the base formula.
How to Calculate Occupancy Rate
The formula is simple: (Booked Nights ÷ Available Nights) × 100 [1][4]. The part that trips people up is the denominator. You want available nights, not total calendar days. Available nights means nights your property was actually open for booking – not dates blocked for owner stays, maintenance, or personal use [4].
That one detail can change the number in a hurry. Let’s say you book 20 nights in a 30-day month, but 4 nights are blocked for plumbing work. If you divide 20 by 30, you get 66.7%. But those 4 nights were never on the market. The right math uses 26 available nights, which gives you an occupancy rate of 76.9% [4].
| Scenario | Total Days | Blocked (Owner/Maintenance) | Available Nights | Booked Nights | Occupancy Rate |
|---|---|---|---|---|---|
| Incorrect: total days used | 30 | 0 | 30 | 20 | 66.7% |
| Correct Investor Calculation | 30 | 4 | 26 | 20 | 76.9% [4] |
Occupancy vs ADR vs RevPAR: What Each Metric Measures
Once you’ve measured occupancy the right way, put it next to pricing and revenue. Occupancy shows calendar use. ADR (Average Daily Rate) shows what guests pay per night. RevPAR (Revenue Per Available Night) connects the two [1][2]. Use RevPAR to see whether pricing and occupancy are working in sync. Together, these metrics show if demand, pricing, and fixed costs line up.
| Metric | Formula | What It Measures | When to Use It |
|---|---|---|---|
| Occupancy Rate | (Booked Nights ÷ Available Nights) × 100 | Calendar utilization and demand | To see if you are filling the property [4] |
| ADR | Total Room Revenue ÷ Booked Nights | Pricing power and guest willingness to pay | To benchmark your rates against similar local listings [1] |
| RevPAR | ADR × Occupancy Rate | Revenue efficiency across all available nights | To judge overall investment performance [1][2] |
How to Calculate Break-Even Occupancy for Monthly and Annual Planning
Break-even occupancy is the minimum share of booked nights you need to cover fixed and variable costs. Strategic vacation rental design can help justify higher rates to cover these expenses. You calculate it by dividing fixed costs by your net revenue per booked night – ADR minus variable costs [8].
Fixed costs are the bills you pay whether anyone checks in or not, like your mortgage, property taxes, insurance, and software subscriptions. Variable costs go up with each booking – cleaning, guest supplies, and Airbnb’s host service fee, which is typically 3% [1][3].
If your fixed monthly costs are $3,000 and your net revenue per booked night is $200, you need 15 booked nights. On a 30-night month, that equals 50% occupancy [8]. Many short-term rentals break even at around 40% to 55% occupancy [3].
Use the same math in three ways, based on your planning window.
| Method | Formula | Required Inputs | Use Case |
|---|---|---|---|
| Monthly Break-Even | Fixed Monthly Costs ÷ (ADR − Variable Costs) | Mortgage, utilities, ADR, cleaning and supply costs | Monthly cash flow and gap-night pricing |
| Annual Break-Even | Total Annual Costs ÷ (ADR − Variable Costs) | Annual taxes, insurance, maintenance reserves, ADR | Evaluating a new deal or annual budgeting [8] |
| Occupancy % Target | (Break-Even Nights ÷ Available Nights) × 100 | Break-even nights, total days minus blocked dates | Setting a minimum occupancy goal for a specific season [4] |
That minimum gives you the first benchmark for judging market performance.
What a Healthy Occupancy Rate Looks Like by Market
There’s no single national occupancy target that fits every Airbnb investment. What matters is how your place stacks up against similar listings in your submarket, not against some broad U.S. average.
The projected U.S. average occupancy rate for 2025–2026 is about 54.9% [1]. That’s useful as a reference point, but not much more. Your starting point should be your break-even occupancy. That’s the floor. After that, compare your numbers with local market norms.
Occupancy Benchmarks for Urban, Resort, and Seasonal Markets
Market type does more than anything else to shape what “healthy” looks like. Urban markets usually stay more stable through the year. Resort and coastal markets, on the other hand, can swing hard between busy and slow seasons, with revenue gaps of 3x to 5x between peak and off-peak periods [3][9].
| Market Type | Healthy Occupancy Range | Demand Pattern | Booking Lead Time |
|---|---|---|---|
| Urban | 65–75% [1] | More consistent year-round | 17–20 days [1] |
| Resort / Coastal | 55–70% [9] | Highly seasonal; strong summer or winter peaks | 45–90+ days [1][3] |
| Mountain / Ski | Season-dependent [3] | Extreme seasonality; deep shoulder-season troughs | Varies by season [3] |
Property type pushes the target even more. A city-center studio may need 72% to 80% occupancy to produce solid cash flow. A luxury beach house or one-of-a-kind stay can still be very profitable at 50% to 60% occupancy if ADR is high enough [5][6].
That’s why comps matter so much. Use 5 to 10 true comps with the same bedroom count, similar location tier, and a matching quality level. Otherwise, you’re comparing apples to oranges.
From there, seasonality explains why occupancy moves up and down from month to month.
Reading Occupancy Data in Pittsburgh and Scottsdale
In places like Pittsburgh and Scottsdale, it helps to compare your rolling monthly occupancy rate against two things: your own longer-term performance and nearby comparable listings. That gives you a much better read on whether the property is slipping or just having a soft month.
In Scottsdale, premium properties usually hit 65% to 70% occupancy [8]. That gives you a solid local marker. But one weak month, by itself, doesn’t say much. What matters is whether that month falls below your rolling average or trails nearby comps.
Next, it’s time to look at the levers that drive booked nights across the year.
Seasonality, Pricing, and the Levers That Change Booked Nights
Occupancy moves with the seasons, local events, and your pricing. Once you know your break-even floor, the next job is managing your calendar around those demand swings.
How Seasonality Affects Occupancy Month to Month
Every market has its own rhythm. Nashville, for example, averaged 54% annual occupancy in 2026, with monthly swings from 42% in January to 63% in June [7]. That kind of spread is normal in a seasonal market. The point isn’t to make every month look identical. It’s to plan for the ups and downs.
Use your break-even occupancy as the floor. Then set peak-season and slow-season targets around it. Here’s how demand cycles tend to vary by market type, and what that means for your yearly plan:
| Market Type | Peak Season Occupancy Target | Slow Season Occupancy Target | Pricing Strategy |
|---|---|---|---|
| Urban | 75–85% | 40–50% | Raise rates 2–3x for major events; lower minimum stays mid-week [7][2] |
| Resort / Beach | 80–90% | 20–30% | Use 3–7 night minimums in summer; offer deep monthly discounts in winter [3] |
| Mountain / Ski | 80–90% | 30–40% | Peak pricing during winter holidays; aggressive last-minute discounts in shoulder months [3] |
| Contractor / Workforce | 65–75% | 60–65% | Stable rates year-round; focus on long-stay discounts for 30+ nights [8] |
Minimum stays should shift with the season too. In peak periods, a 3–4 night minimum helps protect your best weekends from one-night bookings that chop up the calendar. In slower periods, cutting that down to 1–2 nights – or even 1 night for last-minute gaps – can help pull in revenue that might otherwise sit there unused [1][2].
That gives you a simple read on what to do next: raise rates, lower minimum stays, or open discount windows.
When Very High Occupancy Signals That Your Rates Are Too Low
A full calendar feels great. But a full calendar can also mean you priced too low.
The goal is not to book every single night. The goal is to earn more from the nights that matter most.
If a high-demand weekend or peak-season stretch sells out more than 30 days ahead, that’s a strong sign your rates were too low for that window [2].
One trap here is Airbnb’s native Smart Pricing tool. It can underprice listings by 20% to 40% because it favors occupancy over host revenue [1]. If you use Smart Pricing, put firm minimum and maximum rate guardrails in place. Third-party dynamic pricing tools usually cost $15 to $30 per property per month, and moving from static pricing to dynamic pricing can lift revenue by 15% to 40% [1][3].
Concrete Steps That Increase Booked Nights
The main occupancy levers are pretty clear. Airbnb ranks conversion rate – the share of views that turn into bookings – as its single most important algorithm signal [1]. In plain English, that means the listing has to turn interest into action. The tactics below either improve conversion or help fill calendar gaps.
Professional photography is one of the best places to start. A shoot usually costs $300–$800 and can increase booking rates by up to 40% [3]. Good photos set expectations fast. After that, your title, description, and amenity tags need to match the guest experience. If the listing promises one thing and the stay feels like another, trust drops and bookings get harder to win.
Response speed has a bigger effect than many investors expect. A response rate below 90% can hurt your search ranking, and the target is a 100% response rate with an average reply time under one hour [1]. Superhost status – which requires 10+ stays, a 4.8+ rating, under 1% cancellations, and a 90% response rate – drives a 22% revenue uplift on average [10].
Review quality also shapes booked nights in a quiet but direct way. If a review subcategory like Cleanliness, Accuracy, or Check-in drops below 4.7, search performance can suffer [1].
For remote owners, steady occupancy usually comes down to four things: listing optimization, dynamic pricing, guest support, and housekeeping. Rank One Stays provides those systems for investors in Scottsdale, Denver, Pittsburgh, and Lighthouse Point, with fees starting at 10% and average revenue 38% above market.
Next, track those swings over 30, 90, and 365 days so you can tell the difference between normal seasonality and an actual performance problem.
Tracking Occupancy and Using Professional Management to Keep It Steady
DIY vs. Professional Airbnb Management: Occupancy & Revenue Compared
How to Use 30-Day, 90-Day, and 365-Day Tracking to Make Decisions
Seasonality explains why occupancy shifts. Rolling tracking shows whether that shift is normal or a sign of trouble. Use the 30-day view for gap-night fixes, the 90-day view for seasonal pricing, and the 365-day view for cash-flow planning.
Your 30-day view is tactical. Track booking pace each week and focus on gap nights. If you have open nights in the next 7 days, lower your minimum stay to 1 night and think about a small last-minute discount to pick up late demand [2][4].
Your 90-day view is about seasonal patterns. If a high-demand weekend books more than 30 days in advance, your rates were likely too low. If more than 20% of the calendar is still open within 14 days of arrival, your rates may be too high, or your minimum stays may be too strict [2][7].
Your 365-day view is the big-picture check. Compare annual occupancy and ADR with last year and with local comps. That helps you see whether your base pricing is doing its job or simply filling nights at the wrong rate [1][4].
Here’s a simple framework for action:
| What the Data Shows | What to Do |
|---|---|
| Below break-even | Cut costs or raise rates fast |
| Near market average, but weak revenue | Audit ADR and fee structure; test rate increases |
| Consistently above 90% | Test a 10%–15% rate increase [4] |
| High views, low conversion (below 2%–3%) | Fix listing quality – photos, description, reviews [1] |
If occupancy still feels erratic after you adjust pricing and minimum stays, the next thing to look at is management quality.
DIY vs Professional Management: Occupancy Stability Compared
Self-management usually works best for owners who live nearby and can move fast. The gap in performance is hard to miss: professionally managed listings average 75% occupancy, while self-managed properties average 58% [1].
Remote owners deal with extra risk. A midnight lockout, a repair issue, or a last-minute cancellation that needs a fast rebooking can’t sit until morning. Someone local has to handle it. If you live more than 30 minutes from the property, spend more than 10 hours a month on operations, or your self-managed occupancy drops below 70%, professional management is often the more practical option [7].
| Factor | DIY Management | Professional Management |
|---|---|---|
| Average Occupancy | ~58% [1] | ~75% [1] |
| Response Speed | Varies by owner schedule | 24/7; typically under 15 minutes [5] |
| Pricing Strategy | Static or platform Smart Pricing | Daily dynamic pricing with human oversight [2] |
| Owner Workload | 15–20 hours per week [7] | Near zero for owner [7] |
| Remote Capability | High risk for emergencies | Full local support for maintenance and cleaning [5] |
| Revenue Impact | Lower | 23%–104% higher gross revenue [1] |
For remote owners, day-to-day stability often comes down to one thing: who is handling pricing, guest messages, and turnover.
Conclusion: The Occupancy Targets That Actually Matter
Know your break-even occupancy. That’s the floor you need to protect. From there, measure performance against local comps across 30-, 90-, and 365-day windows, and always read occupancy next to ADR. A 58% annual occupancy rate in a seasonal beach market means something very different from 58% in a year-round urban market. The target is not one magic number. It’s the rate that covers your costs, beats local comps, and stays steady through the year.
For owners who want a managed path to stronger occupancy, contact Rank One Stays to see if your property qualifies.
FAQs
What is a good occupancy rate for my market?
A healthy occupancy rate usually falls between 60% and 70%, but the right goal depends on your property type and where it’s located.
For example, urban studios may hit 70% to 80%. On the other hand, luxury or one-of-a-kind vacation homes can still be profitable at 50% to 60% because they charge higher nightly rates.
So instead of chasing 100% occupancy, focus on the balance between booked nights and a competitive Average Daily Rate.
How do I calculate break-even occupancy?
Break-even occupancy is the minimum number of booked nights you need to cover your operating costs, including the mortgage, taxes, utilities, and management fees.
Use this formula: Total Annual Operating Expenses / (Average Daily Rate × (1 – Operating Expense Percentage)).
A lot of investors run a few occupancy scenarios, not just one, to stress-test cash flow. That gives you a clearer sense of how the property might perform in slower months, not just on good days.
With professional management, break-even happens when the extra revenue from better pricing, calendar control, and guest handling is higher than the management fee.
When does high occupancy mean my rates are too low?
High occupancy can be a warning sign. If your calendar fills almost as soon as you open new dates – say, within 48 hours – your nightly rate may be too low. It feels good to see a full calendar, but pushing for 100% occupancy often means cutting prices so much that your total revenue drops.
A lot of revenue models point to a 65% to 75% sweet spot. If your occupancy sits well above similar local listings, there’s a good chance you’re leaving money on the table.