
If you want the short answer, here it is: in 2026, many U.S. Airbnb listings will land around 55% to 57% annual occupancy, but that number only helps if you compare it with ADR, RevPAR, and local comps.
Here’s the part I’d focus on first:
- Below 50% occupancy usually means the listing needs work
- 50% to 60% is around the U.S. middle for many markets
- 60% to 70% is strong in a lot of cities
- 70%+ can be great, but it may also mean your rates are too low
- RevPAR matters more than occupancy alone, because booked nights mean less if the nightly rate is weak
- Local market type changes the target: Scottsdale can sit near 63%, while Pittsburgh may be closer to 53%
- Use trailing 12-month data, not just one strong or weak month
If I were sizing up a property, I’d ask one simple question: can this place still work at or a bit below local median occupancy? If the answer is no, the deal may be too thin.
A quick way to read the benchmarks:
| Occupancy | What it often means |
|---|---|
| Under 50% | Weak in most markets |
| 50%–60% | Around market norms |
| 60%–70% | Strong |
| 70%–85% | Top-tier in many markets, or a sign rates may be too cheap |
The main takeaway is simple: don’t chase occupancy by itself. I’d track occupancy, ADR, and RevPAR together, then compare them against similar homes in the same area.
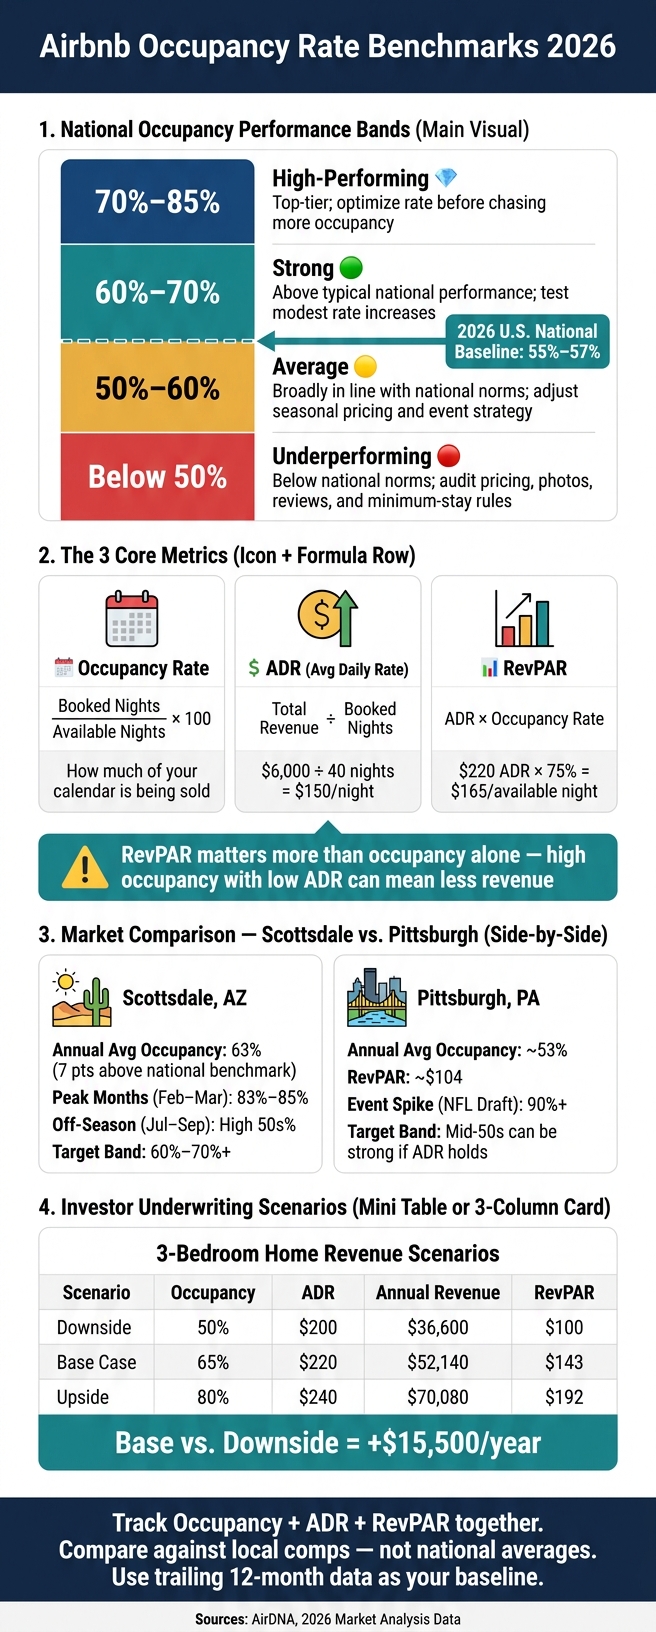
Airbnb Occupancy Rate Benchmarks 2026: Performance Bands & Key Metrics
What’s a Good Airbnb Occupancy Rate? (+ How To Improve Yours)
sbb-itb-103bddb
How to Calculate Airbnb Occupancy and Read the Core Metrics
The formula is simple: Occupancy Rate = (Booked Nights ÷ Available Nights) × 100. But this is where a lot of owners slip up: they use the wrong denominator.
Available nights are not the same as calendar nights. You should remove owner stays, maintenance blocks, and other blocked dates from the total. Say a Scottsdale condo has 31 days in March. If 4 nights are blocked for the owner and 2 more are set aside for cleaning, that leaves 25 available nights. If 20 of those nights are booked, occupancy is 80%. That matches the method used in market benchmarks.
Occupancy Rate, ADR, and RevPAR Defined
Occupancy tells you one part of the story. ADR and RevPAR fill in the rest.
ADR (Average Daily Rate) = Total booking revenue ÷ Booked nights.
If a Denver property brings in $6,000 in booking revenue across 40 booked nights, its ADR is $150 per night.
RevPAR (Revenue Per Available Rental Night) = ADR × Occupancy Rate.
If a Scottsdale home posts an ADR of $220 and an occupancy rate of 75% for the month, its RevPAR is $165 per available night.
| Metric | Formula | What It Tells You |
|---|---|---|
| Occupancy Rate | Booked nights ÷ available nights × 100 | How much of your open calendar is being sold |
| ADR | Total booking revenue ÷ booked nights | Pricing power per booked night |
| RevPAR | ADR × occupancy rate | Combined revenue efficiency per available night |
One quick note: dynamic pricing can push occupancy up while pulling revenue down. So higher occupancy, by itself, doesn’t always mean better results. With these metrics in place, the next move is to compare them against 2026 market benchmarks.
Which Reporting Periods Owners Should Watch
Each reporting window tells you something different.
- Monthly occupancy helps you track near-term pacing. It’s useful when you want to spot a sudden drop after changing your listing or adjusting pricing.
- Rolling 90-day occupancy filters out some of the short-term swings and gives you a cleaner view of medium-term movement.
- Trailing 12-month (T12) occupancy shows the full seasonal cycle and is the steadiest number for annual reviews and investment decisions.
Monthly snapshots can throw you off. A 2026 market analysis found that the top three months account for 37.3% of annual RevPAR at the U.S. median, and the median peak-to-trough RevPAR ratio is 3.25x[9]. That’s why T12 should be your baseline for the benchmark ranges that follow.
Airbnb Occupancy Rate Benchmarks for 2026
Read these 2026 benchmarks on a trailing 12-month basis. That should be your baseline. Monthly swings can make a market look better or worse than it is.
National Benchmark Ranges and Performance Bands
AirDNA places 2026 U.S. occupancy in the mid-50% range, with forecasts around 54.7% to 55.8%. Some analyses put it at 50% to 54% as supply growth moves ahead of demand.[5][15][8] For most owners, 55% to 57% is a fair national baseline for a well-managed listing in an average market.[6][4][1]
The table below turns those national figures into practical performance bands.[6][4][1]
| Occupancy Band | Performance Label | Typical Market Context | Common Owner Actions |
|---|---|---|---|
| Below 50% | Underperforming | Below national norms in most market types; often points to pricing, listing visibility, reviews, or property-fit issues | Audit pricing, photos, reviews, and minimum-stay rules |
| 50%–60% | Average | Broadly in line with national norms for many markets | Adjust seasonal pricing and event strategy |
| 60%–70% | Strong | Above typical national performance; often seen in well-managed urban or growing leisure markets | Test modest rate increases and improve amenities |
| 70%–85% | High-performing | Top-tier performance in most U.S. markets; common in core urban districts or standout resort properties | Optimize rate before chasing more occupancy |
Still, an occupancy rate never tells the whole story by itself. Market type and property quality shape whether a number is good, weak, or just okay.
How Benchmarks Differ by Market Type
Urban listings often get steadier year-round demand, which can support annual occupancy in the 65%–75% range for well-located units.[13][14] Beach and resort markets can reach 80%+ occupancy in peak months, but annual averages usually fall in the mid-50s to mid-60s once the off-season kicks in.[13][14]
Mountain and ski markets work in much the same way: big winter peaks, softer shoulder seasons, and a summer segment that keeps growing.[4][1] Luxury and large destination homes are a different animal. They can drive strong revenue at 40%–60% annual occupancy if ADR is high enough, so pushing for more nights at the cost of rate often backfires for this property type.[4][1]
In short, geography changes the math. Local travel patterns matter more than national averages.
That shows up fast when you compare specific markets, because the same occupancy rate can mean two very different things.
What These Ranges Look Like in Scottsdale and Pittsburgh
Scottsdale and Pittsburgh make this point pretty clear: local comps matter more than national averages.
Scottsdale, AZ often beats national averages.[10][11] One 2026 analysis puts average occupancy at 63%, about 7 percentage points above the 56% national benchmark it tracks, with February and March peaking at 83%–85% occupancy.[11] Even the slower summer stretch from July through September stays in the high-50% range, though one off-season month – June 2025 – fell to 37.7%.[12]
For Scottsdale, the 50% to 60% band is more of a floor than a target. A well-positioned property in a popular neighborhood should reasonably aim for the 60%–70% strong band, and high-performing listings can push past 70% annually.[10][11]
Pittsburgh, PA looks different. Recent data puts average annual occupancy at about 53%, with RevPAR near $104.[2][3] That sits a bit below the national mid-50s baseline, but major events can cause short spikes. The NFL Draft, for example, pushed some Pittsburgh-area listings above 90% for that week.[7] In Pittsburgh, mid-50% occupancy can still be strong if ADR holds.[3]
In both markets, compare your property against same-bedroom, same-neighborhood comps.
How Investors Use Occupancy Benchmarks to Evaluate a Property
Benchmarks matter when they affect a buy, pricing, or management call. Once you know the local benchmark, the next step is simple: check whether the property can hit your return target without relying on a best-case scenario.
Comparing a Property Against the Local Market
Start with 5–10 direct comps that match as closely as possible:
- Same bedroom count
- Same property type
- Same general neighborhood
- Similar amenity level
Use 12–36 months of monthly occupancy, ADR, and RevPAR data for each comp. Then use the median figures as your baseline, not the best listings in the set.
Now compare those local medians against your pro forma. If the market median annual occupancy is 65% but your deal only works at 80%, that’s a warning sign, not a green light. A good deal should still cash-flow at or a bit below the local median. Many investors also apply a ~15% downward adjustment to third-party occupancy and ADR estimates to leave room for data optimism and softer market conditions.[18][16]
Using Occupancy, ADR, and RevPAR in Underwriting
The math is simple: Annual room revenue = ADR × booked nights. That’s why it helps to run downside, base, and upside cases. A small move in occupancy can change revenue fast.
The table below shows a 3-bedroom home using representative ADR assumptions:
| Scenario | Occupancy Rate | ADR | Annual Booked Nights | Annual Room Revenue | RevPAR |
|---|---|---|---|---|---|
| Downside | 50% | $200 | 183 | $36,600 | $100 |
| Base Case | 65% | $220 | 237 | $52,140 | $143 |
| Upside | 80% | $240 | 292 | $70,080 | $192 |
Going from the downside case to the base case adds about $15,500 in annual room revenue. That can be the line between barely breaking even and producing strong cash flow. After that, subtract operating expenses to get NOI, then test DSCR using the downside case. If the property can’t cover its debt at 50% occupancy and a conservative ADR, the upside case may look nice on paper but the deal still carries more risk.[17][19]
When Low or Very High Occupancy Signals Action
When a property falls short of the benchmark – or blows past it – the first thing to ask is: what’s causing the gap?
Sub-50% occupancy in a healthy market usually points to a listing problem, not a market problem. The usual issues are overpricing, weak photos, missing amenities, or minimum-stay rules that shut out shorter bookings. In many cases, the fix is pretty direct: turn on dynamic pricing, update the cover photo, and allow shorter minimum stays.
On the other hand, 80%+ occupancy in a 55%–65% market usually points to underpricing.[21][20] If your ADR sits 15%–20% below similar listings and your calendar stays nearly full, you may be leaving money on the table. Try a 5%–10% rate increase and watch occupancy for 60–90 days. If occupancy stays above the local benchmark and RevPAR goes up, that’s a strong sign the property was priced too low.
When gaps come from pricing, listing quality, or day-to-day operations, management is often the fastest lever to pull. Rank One Stays helps owners close those gaps through listing optimization, dynamic pricing, 24/7 guest support, professional housekeeping, and damage claims. Property owners partnering with Rank One Stays earn 38% more revenue than the market average, with management fees starting at 10%.
Turning Benchmark Data Into Better Performance
Benchmark data only matters when it changes what you do next. The goal isn’t to stare at occupancy, ADR, and RevPAR. It’s to use them to earn more per available night without making the guest stay worse.
A Simple Monthly Scorecard for Owners
The simplest way to keep tabs on performance is a steady monthly review. Same format. Same day each month. That kind of rhythm makes it much easier to spot what’s changing.
Track these five numbers for the prior month:
- Occupancy rate
- ADR
- RevPAR
- Local comp-set benchmark values for each metric
- Your variance versus market
Example: 3-bedroom Scottsdale property, April 2026.
- Reporting period: 04/01/2026–04/30/2026
| Metric | Your Property | Local Comp-Set Benchmark | Variance |
|---|---|---|---|
| Occupancy | 63.3% | 66.0% | –2.7 pts |
| ADR | $280.00 | $260.00 | +$20.00 (+7.7%) |
| RevPAR | $177.33 | $171.60 | +$5.73 (+3.3%) |
Here, occupancy sits a bit below market, but ADR and RevPAR are both ahead. That’s usually a good trade-off. In plain English: the property is booking a little less often, but it’s making more money when it does book, and the end result is still stronger than the market. No immediate fix needed.
That’s what makes the scorecard useful. You can see the story at a glance without digging through a pile of numbers. Still, one month on its own can fool you. The better move is to watch the variance trend month to month.
If variance stays negative for a few months in a row, pricing or operations is usually the next place to look.
How Professional Management Can Improve Benchmark Performance
When the scorecard keeps showing underperformance, management is often the fastest way to change the pattern.
Most gaps come down to three things: pricing, listing quality, and operations. Full-service management tackles all three together. The main levers are rate control, listing quality, and operations.
Dynamic pricing can improve both occupancy and ADR in a meaningful way. Changing rates daily based on demand, local events, and booking pace helps keep occupancy in a target band – often around 60%–75%, depending on the market – while still holding ADR on high-demand dates.
Then there’s the listing and guest side of the business. Professional photography can help the property stand out. Better listing copy can improve conversion. Around-the-clock guest support and professional housekeeping often lead to stronger reviews and better search visibility. Those pieces work together.
Rank One Stays bundles these services into one offer. Owners who work with the team earn 38% more revenue than the market average, with fees starting at 10%.
Conclusion: The Occupancy Numbers That Matter Most in 2026
Once you’ve benchmarked performance and made adjustments, RevPAR should be the final score you watch most closely.
National U.S. short-term rental occupancy has generally stayed in the low-to-mid 50% range. That gives useful context, but it’s not a target. A national average can’t tell you how a 3-bedroom home in Scottsdale should perform against nearby alternatives.
What matters more is how your property stacks up against similar listings in your own submarket.
In many U.S. markets, 65%+ occupancy with competitive ADR is strong. But if you want one number that sums things up best, it’s RevPAR versus local comps. It pulls rate and occupancy into a single figure, which makes it a much better read on actual performance.
Consistent monthly benchmarking keeps pricing, management, and acquisition decisions tied to what the market is doing. Occupancy gives context, ADR shows pricing power, and RevPAR shows how the property is actually performing.
FAQs
What is a good Airbnb occupancy rate in 2026?
A good Airbnb occupancy rate in 2026 depends on where your property is and what kind of place you’re renting out. An apartment in a city often stays in the 65% to 80% range across the year. A larger vacation home can look very different, with bigger ups and downs from season to season.
So instead of chasing one “ideal” number, many investors look at local benchmarks and weigh occupancy alongside RevPAN. For example, they might compare rates like 68% in Scottsdale, 71% in Nashville, and 74% in Savannah to see what’s normal for that market and whether higher occupancy is still leading to better income per available night.
Why does RevPAR matter more than occupancy alone?
Occupancy on its own can paint an incomplete picture. It tells you how often a property is booked, but not how much money each open night brings in. So a place can look busy and still fall short if the rates are set too low.
RevPAR gives you a better read because it looks at both occupancy and nightly rate at the same time. In plain English: a property with fewer booked nights and stronger pricing can beat one that’s full but underpriced.
How should I compare my property to local comps?
Research at least 10 similar properties within a 1-mile radius.
Then compare your target daily rate to how those nearby listings are doing. Your goal rate should cover your fixed costs and leave room for a 30% to 50% profit margin.
Booking pace matters too.
- If your unit gets booked within 48 hours, your rate may be too low.
- If you go 2 weeks without any inquiries, it may be too high.
This gives you a simple gut check: don’t price in a vacuum. Look at what the market around you is telling you.