

If I had to pick fast: AirDNA is better for market data, and Mashvisor is better for property analysis. That’s the short answer.
If you’re buying, underwriting, or repricing a short-term rental, here’s what matters most:
- AirDNA is built for market-level data like occupancy, ADR, RevPAR, and future pacing
- Mashvisor is built for deal-level analysis like cash flow, cap rate, cash-on-cash return, and STR vs. LTR comparison
- AirDNA covers 10 million+ rentals across 120,000+ markets
- Mashvisor tracks 11 million+ short-term rental properties and mixes in MLS and public-record data
- AirDNA starts at $19.99/month
- Mashvisor runs from $39.99 to $99.99/month and includes a 14-day free trial
So if I’m asking, “Is this market strong?” I’d look at AirDNA.
If I’m asking, “Will this property cash-flow?” I’d look at Mashvisor.
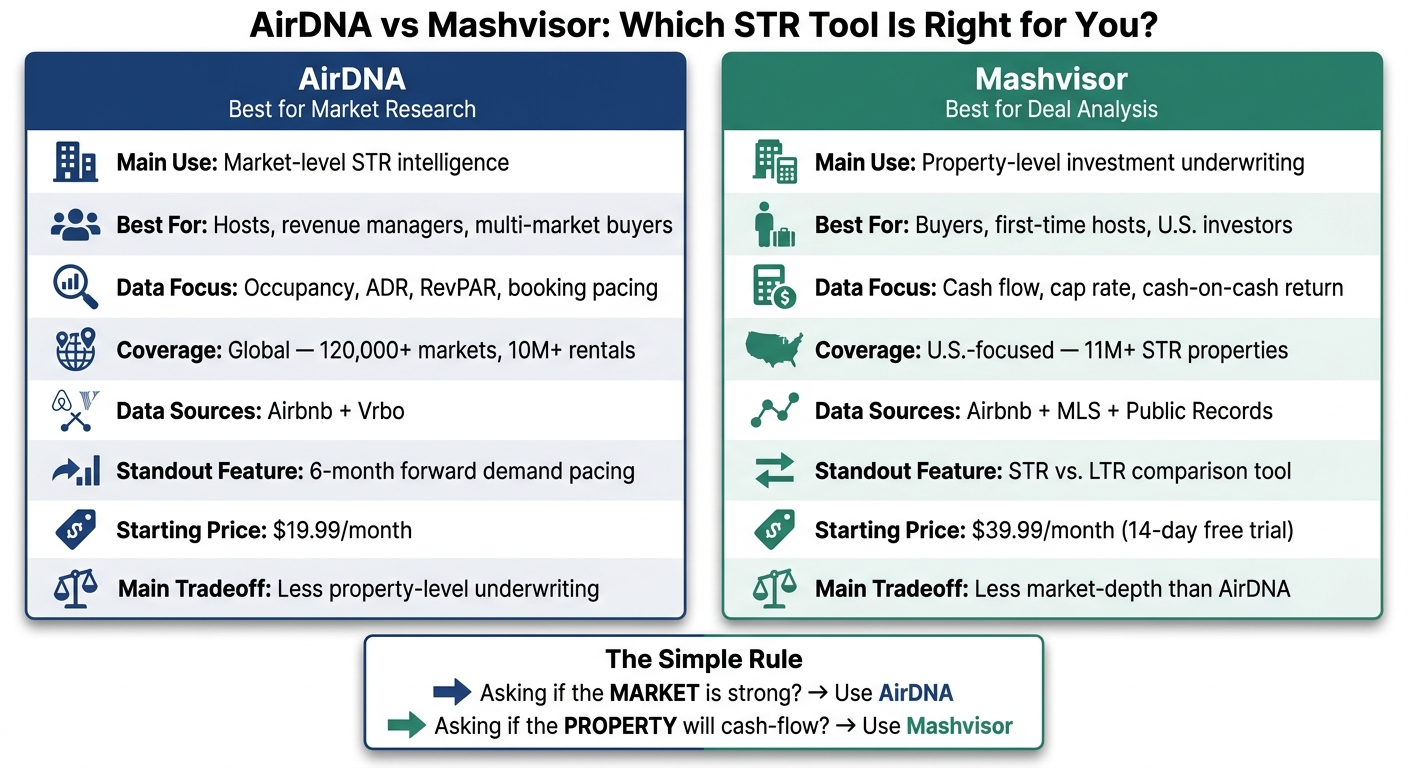
AirDNA vs Mashvisor: STR Tool Comparison at a Glance
AirDNA vs. Mashvisor: Which is better?
sbb-itb-103bddb
Quick Comparison
| Criteria | AirDNA | Mashvisor |
|---|---|---|
| Main use | Market research | Deal analysis |
| Best for | Hosts, revenue managers, multi-market buyers | Buyers, first-time hosts, U.S. investors |
| Data focus | Occupancy, ADR, RevPAR, pacing | Cash flow, cap rate, taxes, ROI |
| Coverage | Global | U.S.-focused |
| Data sources | Airbnb and Vrbo | Airbnb, MLS, public records |
| Standout tool | 6-month forward pacing | STR vs. LTR comparison |
| Starting price | $19.99/month | $39.99/month |
| Main tradeoff | Less property-level underwriting | Less market-depth than AirDNA |
My takeaway: use AirDNA to judge the market, use Mashvisor to judge the deal, and remember that neither tool fixes weak pricing, weak photos, or slow guest replies. The article below breaks down where each one helps most, where forecasts can miss, and which tool fits your buying style.
AirDNA vs Mashvisor at a Glance
AirDNA is market-first. Mashvisor is deal-first. That’s the simplest way to split them apart.
Use the table below to separate market research from deal underwriting.
| Feature | AirDNA | Mashvisor |
|---|---|---|
| Primary Focus | STR market intelligence and pacing | Real estate investment and ROI analysis |
| Geographic Coverage | Global; 120,000+ markets and 10 million+ vacation rentals [5] | U.S.-focused; 11 million+ short-term rental properties [3] |
| Data Sources | Airbnb and Vrbo data [3][2] | Airbnb, MLS, and public records [3][1] |
| Core Metrics | ADR, RevPAR, occupancy, booking lead time [2] | Cap rate, cash-on-cash return, cash flow [1] |
| Unique Tool | Future pacing up to 6 months forward [2] | Heatmap and STR vs. LTR comparison [1] |
| Export Formats | CSV and PDF [3] | PDF property and neighborhood reports [3] |
Market Coverage and Data Sources
AirDNA tracks more than 10 million vacation rentals across 120,000+ markets worldwide [5]. If you’re checking seasonality across several cities or countries, that broad reach helps.
Mashvisor stays focused on the U.S. It monitors 11 million+ short-term rental properties [3] and blends STR data with MLS and public records. That setup works well for investment screening because you can review property tax history, sales comps, and STR revenue estimates in one dashboard.
Revenue Metrics, Filters, and Comp Quality
AirDNA has the edge on STR performance data. It tracks occupancy, ADR, RevPAR, booking lead time, and average length of stay. It also projects supply and demand up to 6 months ahead [2]. That pacing view can sharpen underwriting because it shows whether a market is tightening or softening before you buy.
AirDNA also says its data is 94.9% accurate against Airbnb and 98.7% against Vrbo [2]. Still, there’s a catch. Independent research from 2024 suggested its occupancy method may treat blocked dates as booked dates in some cases [2].
Mashvisor comes at the problem from another direction. Its rental comp tool gives each comp a similarity score and distance marker [6]. On top of that, you can filter by cap rate, budget, neighborhood, and STR vs. LTR performance [1]. Those filters matter because they shape the revenue estimate by trimming comps down to properties that look more like your target deal.
It also includes property tax and sales history data. That matters when you’re working through cash-on-cash return and trying to avoid rosy projections [3][1].
| Metric | AirDNA | Mashvisor |
|---|---|---|
| Occupancy | Historical occupancy with 6-month future pacing [2] | Historical occupancy [1] |
| Revenue | Gross revenue estimates [2] | Net cash flow after expenses [1] |
| Comps | Custom comp sets and competitor calendars [4] | Similarity score and distance for rental comps [6] |
| Investment Metrics | Revenue-focused | Cap rate, cash-on-cash return, property tax, sales history [1][3] |
| Neighborhood View | Submarket performance scores | Heatmap for ROI, listing price, and occupancy [1] |
Pricing, Plans, and Overall Value
AirDNA’s MarketMinder starts at $19.99/month for one market and goes up to $39.99/month [2]. Enterprise API pricing is not public, so you have to contact sales [3].
Mashvisor’s plans run from $39.99 to $99.99/month [3]. API access also sits behind a custom enterprise plan. It does offer a 14-day free trial [3], which makes it easier to test before paying.
The value comes down to how you invest. AirDNA goes deeper on STR pacing and comp-set analysis. Mashvisor gives you investment calculators, heatmaps, and a more complete underwriting workflow in one place. If your main job is sizing up markets, AirDNA makes more sense. If you’re trying to judge whether a property will pencil out, Mashvisor is usually the better fit.
Which Tool Fits Your Investing Style
Once you see how these tools differ, the next step is simple: match the tool to the way you invest. Use AirDNA for market screening. Use Mashvisor for property underwriting.
Best Choice for First-Time Hosts
If you’re trying to estimate first-year revenue for one property, Mashvisor is the better place to start. Its calculator pulls together revenue, taxes, and insurance, then lets you compare short-term and long-term rental returns for the same address [1][2].
AirDNA can help you spot whether a market looks crowded. But it doesn’t show whether one house will still cash-flow after expenses. For a first purchase, that matters more. So if you want the faster route from idea to deal analysis, Mashvisor makes more sense.
Best Choice for Remote Owners and Out-of-State Buyers
Remote buyers need two things: confidence in the location and confidence in the numbers.
Mashvisor helps with the first part. Its heatmap makes it easier to spot high-occupancy areas without visiting in person, and its STR regulations page gives a snapshot of current rules for owner-occupied and non-owner-occupied properties in major U.S. markets [6].
AirDNA comes in after you’ve narrowed your options. Its forward pacing data shows whether demand is picking up or cooling off before you move ahead [2]. A practical way to use both is pretty straightforward:
- Use Mashvisor to screen deals and neighborhoods
- Use AirDNA to check market direction before making an offer
Once you’ve picked the market, the job changes. At that point, it becomes less about screening and more about scale.
Best Choice for Portfolio Investors and Operators
For portfolio investors, repeatability matters more than one-off deal analysis. When you’re buying at scale, the goal isn’t just finding one good property. It’s building a process you can use across many markets.
That’s where AirDNA has the edge. Its bulk data exports and cross-market supply and demand analysis make it easier to compare markets across multiple states and follow the same underwriting process each time [2]. Mashvisor still plays a part before purchase, especially if you want MLS-linked deal flow. But for market selection and revenue benchmarking over time, AirDNA does more of the heavy lifting.
| User Type | Primary Goal | Better-Fit Tool | Reason |
|---|---|---|---|
| First-Time Host | Estimate first-year revenue | Mashvisor | Combines MLS search with cash-flow and ROI calculators |
| Remote Owner | Neighborhood selection and rule check | Mashvisor | Heatmap and STR regulations summary |
| Portfolio Operator | Repeatable underwriting and cross-market analysis | AirDNA | Bulk exports, forward pacing, and market-wide supply/demand trends |
Both tools stop at analysis. Revenue still comes down to execution. Professionally managed listings earn 23% to 104% more gross revenue than self-managed ones [2], and that gap comes from what happens after the data review. Rank One Stays helps owners turn projections into revenue.
Using STR Data to Improve Real Revenue
Where AirDNA and Mashvisor Projections Fall Short in Practice
AirDNA and Mashvisor can point you in the right direction. But those numbers only work if the day-to-day operation backs them up.
Both tools lean on market averages. That becomes a problem when the comp set blends luxury homes with budget units. In that case, a single property’s results can miss the forecast by 25% or more.
A few common issues can drag revenue down fast:
- Static pricing
- Weak photos
- Slow replies
- Inconsistent housekeeping
Even the platform tools don’t always fix that. Airbnb’s Smart Pricing can underprice listings by 20% to 40% [2], and a response rate below 90% can hurt search rank [2].
So the gap usually isn’t about the spreadsheet. It’s about execution.
How Rank One Stays Helps Owners Act on the Numbers
Once the forecast is set, the next part is simple to say and harder to do: someone has to run the property well.
Owners still need to manage pricing, listing optimization, guest support, housekeeping, and claims handling. That’s where many projections start to drift from what a property actually earns.
Dynamic pricing and daily pacing reviews can lift revenue in a meaningful way, but only when someone is making those calls every day. That includes adjusting minimum stays to fill empty nights between bookings and reacting to market shifts before occupancy slips.
Rank One Stays handles dynamic pricing, listing optimization, guest support, housekeeping, and damage claims for owners in Scottsdale, Denver, Pittsburgh, and Lighthouse Point. It also offers interior design and staging for investors who want a turnkey setup.
Conclusion: When to Choose AirDNA and When to Choose Mashvisor
Choose AirDNA for market-level revenue trends. Choose Mashvisor for property-level buy analysis.
The simplest way to split them is this: AirDNA tells you how a market is doing. Mashvisor helps you decide if a specific property is worth buying.
AirDNA is the better pick for active hosts and revenue managers who need forward demand data, pacing, and market-wide benchmarks.
Mashvisor is the better pick for buyers who need short-term rental vs. long-term rental comparison, ROI screening, and neighborhood-level underwriting.
| AirDNA | Mashvisor | |
|---|---|---|
| Best for | Active hosts and revenue managers | Buyers and acquisition research |
| Strongest feature | Market pacing and demand trends | STR vs. long-term rental comparison |
Even the best data won’t produce revenue on its own. You still need daily pricing, guest communication, and solid operations. Data helps only when operators use it day in and day out.
Once the analysis is done, execution drives the return. For hands-off help, Rank One Stays manages pricing, operations, and guest experience for owners in Scottsdale, Denver, Pittsburgh, and Lighthouse Point.
FAQs
Can I use both tools together?
Yes. They do different jobs, and they work well together.
AirDNA is stronger for market and comp research, demand and pacing, and revenue projections. Mashvisor leans more toward property- and neighborhood-level income estimates and investment analysis.
A common workflow looks like this:
- Use AirDNA to narrow down markets and test comps
- Then use Mashvisor to review a specific property’s expected income and returns
That way, you start with the big picture and then move into the deal itself.
How reliable are STR revenue estimates?
STR revenue estimates are useful directional tools for reading market trends, but they are not precise performance forecasts. In most cases, market-level data is more dependable than property-level projections.
Treat these numbers as estimates, and expect variance of around 25%. Automated tools can mistake blocked dates for bookings or rely on older inference models, which can skew the picture.
A safer way to use this data is to model a few cases:
- Conservative
- Moderate
- Aggressive
Then sanity-check the numbers against more than one data source. That extra step can help you avoid leaning too hard on a single tool’s assumptions.
Which tool is better for one property?
For a single property, Mashvisor is usually the better choice.
It gives you property-level underwriting and simple rental income estimates based on MLS and Airbnb data. You also get nationwide U.S. coverage and daily updates, which makes it easier to size up one deal without jumping between tools.
AirDNA does a good job with market and competitor data. But if your goal is to judge one property’s income potential, Mashvisor is often the more reliable, beginner-friendly all-in-one option.