
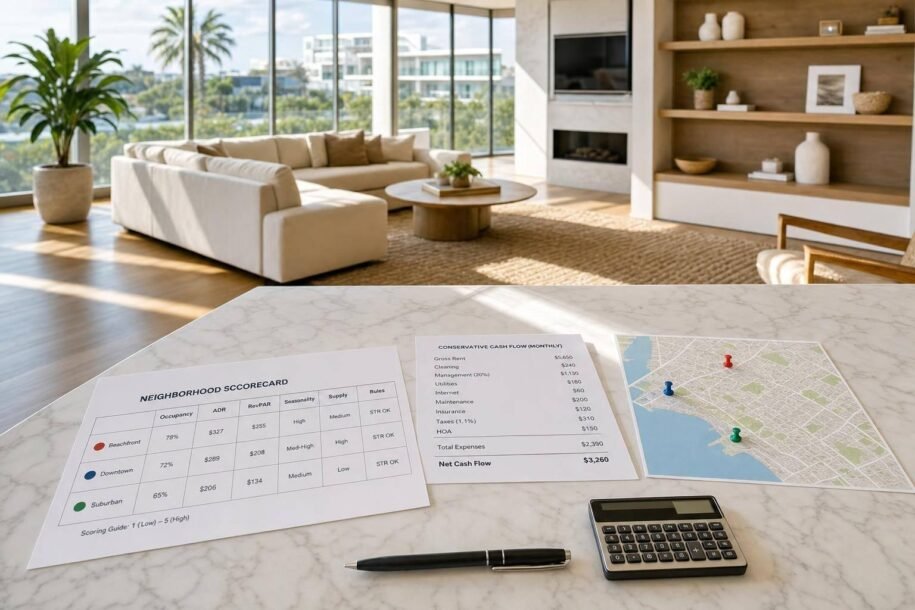
If I were buying my first Airbnb today, I would not trust city averages. I would compare one neighborhood at a time, check four numbers first – occupancy, ADR, RevPAR, and seasonality – then test supply growth, local rules, and nearby demand before I made an offer.
Here’s the short version:
- A city can look average while one neighborhood does far better.
- Occupancy shows how often nights book.
- ADR shows what guests pay per booked night.
- RevPAR shows what the property earns across all nights.
- Seasonality, booking window, and length of stay show how steady income may be.
- Supply growth can cut rates and bookings if too many new listings enter the area.
- Zoning, permits, HOA rules, and taxes can kill a deal even when revenue data looks strong.
- Hospitals, stadiums, universities, parking, walkability, and airport access often explain why one area books better than another.
- I’d use live Airbnb comps plus STR data tools to check the same neighborhood from two angles.
- Before buying, I’d build a simple scorecard and a cash-flow model with a downside case.
A few numbers from the article make the point fast. In Pittsburgh, citywide annual revenue is about $22,900, with 54% occupancy and $138.70 ADR. But Friendship is closer to $33,000, 72% occupancy, and $173.10 ADR. In Scottsdale, one area may sit near $241 ADR at 53% occupancy, while Old Town can reach about $425 ADR at 66% occupancy.
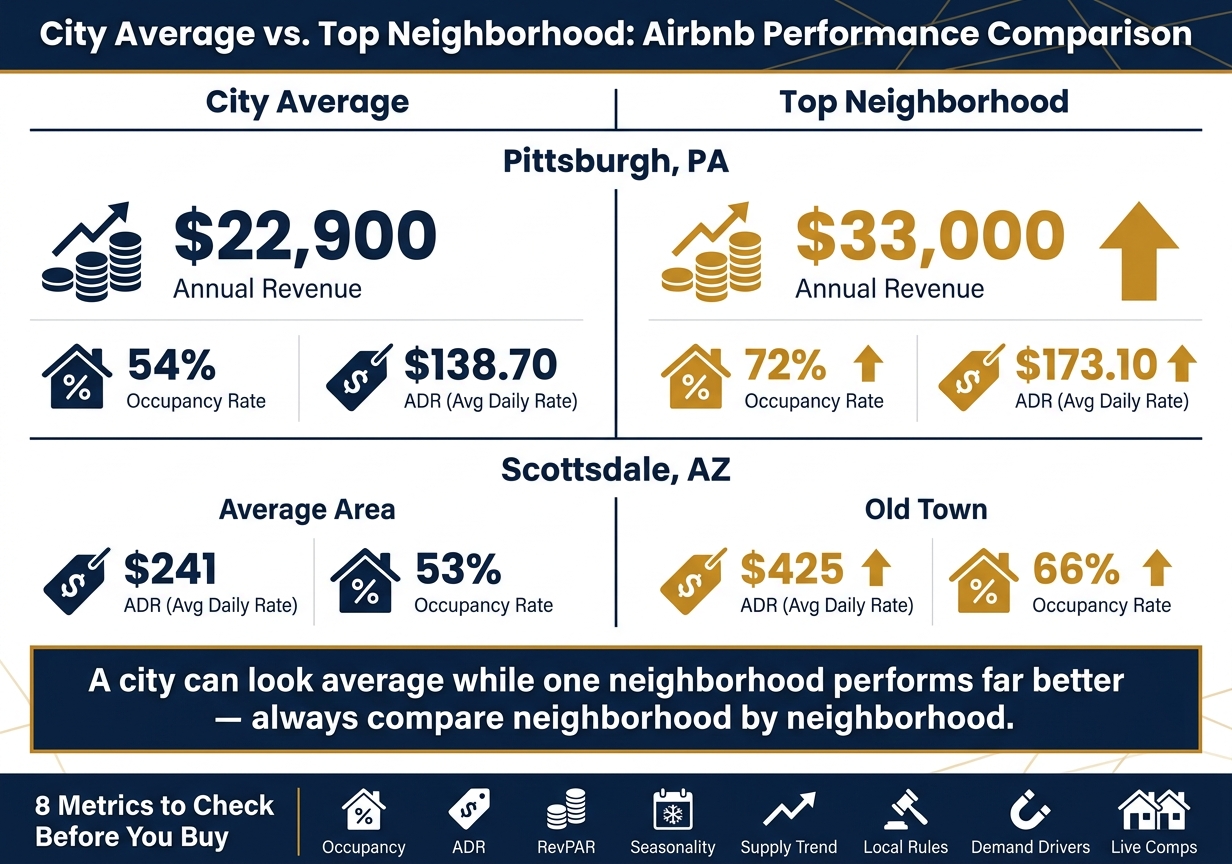
Airbnb Neighborhood Data: City Average vs. Top Neighborhood Performance
How to Find the Best Neighborhoods for Airbnb Using Data (Submarket Analysis Explained)
sbb-itb-103bddb
Quick comparison
| What I’d check | What it tells me | Simple takeaway |
|---|---|---|
| Occupancy | How many nights book | Demand |
| ADR | Revenue per booked night | Pricing power |
| RevPAR | ADR × occupancy | True earning strength |
| Seasonality | Busy vs. slow months | Cash-flow swings |
| Supply trend | New competition | Pressure on rates and bookings |
| Rules and zoning | Whether I can legally operate | Deal blocker if wrong |
| Demand drivers | Why guests choose the area | Booking support beyond peak dates |
| Live comps + STR tools | What’s happening now and over time | Better buy/no-buy call |
My takeaway is simple: I’d pick the neighborhood that still works after lower occupancy, lower ADR, and rule checks – not the one with the flashiest headline numbers.
How to Read Core Airbnb Neighborhood Metrics
Occupancy Rate: How Often Listings Actually Book
Occupancy rate is the share of available nights that get booked. The formula is simple:
Occupancy Rate = (Booked Nights ÷ Available Nights) × 100[1][4][5]
If a listing is open for 30 nights in April and books 21 of them, the occupancy rate is 70%.
In city markets, steady occupancy month after month usually points to a mix of demand sources. That’s a good sign. But if bookings pile up only on weekends, demand can swing a lot and lean heavily on leisure travel. In vacation markets, some seasonality is expected. The key is whether the slower months still bring in bookings or if demand hangs on just a few busy stretches.
A good rule is to underwrite at 10 to 15 percentage points below the neighborhood average. If the numbers still work at that lower level, you’ve got some breathing room.
High occupancy, by itself, doesn’t mean much if the nightly rate can’t hit your return target.
ADR and RevPAR: Nightly Rate vs. Real Earning Power
Once occupancy tells you demand is there, ADR and RevPAR show what that demand is worth.
ADR tells you what guests pay on the nights that book. RevPAR tells you what the property earns across all available nights, including the ones that sit empty.
- ADR = Total booking revenue ÷ Number of booked nights
- RevPAR = ADR × Occupancy Rate
RevPAR is where things get more honest. It shows whether a place with lower rates and stronger occupancy can beat one with high rates and lots of vacancy. Here’s a clear example:[3]
| Scenario | ADR | Occupancy | RevPAR |
|---|---|---|---|
| High-priced, low-booked | $300 | 40% | $120 |
| Mid-priced, well-booked | $200 | 70% | $140 |
The second property makes more per available night even with the lower ADR. That’s why looking at ADR alone can lead you in the wrong direction. A neighborhood may look premium because hosts post high nightly rates, but if too many nights go unbooked, the income picture weakens fast. RevPAR cuts through that by tying price to actual use.
That gap is also why monthly seasonality matters.
Seasonality, Booking Window, and Length of Stay
After occupancy and pricing, timing tells you how steady that income may be.
Pittsburgh scores 79 out of 100 on a seasonality stability index,[6] which means demand stays fairly even through the year. That makes cash flow easier to map out. Scottsdale looks very different. Its busy stretch runs roughly from October through April, then summer slows things down, with July occupancy recorded as low as 37.2%.[7][8][9][10]
The booking window adds another layer. It shows how far ahead guests book, and that affects both pricing and day-to-day planning. Scottsdale’s peak season tends to bring travelers booking golf trips and winter getaways weeks or months in advance. That gives you time to lock in strong rates early. Pittsburgh is more mixed. Business and medical travelers often book within a week of arrival, while event weekends and academic calendar dates can bring longer lead times. Short booking windows call for dynamic pricing tools that can react fast. Longer windows give you more room to set rates and line up cleaning without a last-minute rush.
Average length of stay (LOS) is the last piece. In urban, event-driven neighborhoods, stays often run just one to three nights. That usually means more turnovers, more cleaning costs, and more guest messages every month. In leisure and resort areas, stays often run three to seven nights or more. Longer stays usually mean lower turnover costs and less operating hassle. Professional Airbnb interior design and staging services can further streamline these operations by creating durable, easy-to-maintain spaces.
How to Spot Risk in Neighborhood Data Before You Buy
Last year’s revenue doesn’t tell you what next year will look like. Before you buy, check three things first: supply growth, legal eligibility, and the local demand drivers behind bookings.
Supply Growth and Competitive Pressure
Active listings tell you how many short-term rentals are competing for bookings right now. New listings tell you how fast more supply is entering the market. When listings grow faster than bookings, hosts usually cut rates first. After that, occupancy drops and RevPAR gets squeezed.[15][2]
A neighborhood with 68% occupancy and a $220 ADR last year can look strong at first glance. But if active listings are up 15% and booking volume hasn’t moved, each property is now fighting harder for the same guests.[15][2]
That’s why broad market averages can be misleading. If you’re buying a one-bedroom condo, compare it to other one-bedroom condos. If you’re buying a four-bedroom home, look at that group instead. The main issue is simple: is supply in your property type growing faster than RevPAR over several quarters?[15][2]
Local Rules, Zoning, HOA Limits, and Tax Exposure
Revenue data won’t tell you whether a property can legally operate as a short-term rental. You need to check permits, zoning, HOA rules, annual night caps, and tax duties before you build your cash-flow model.
| Regulatory Layer | What to Verify |
|---|---|
| City/county permit | Is a short-term rental license required, and is it available for this address? |
| Zoning district | Does the property’s zoning allow short-term rentals? |
| Primary-residence rule | Does the city require you to live in the home to rent it short-term? |
| Annual night cap | Is there an annual limit on unhosted nights, such as 90–120 nights per year? |
| HOA/condo bylaws | Does the building or association prohibit or restrict short-term rentals? |
| Lodging/occupancy tax | What local taxes apply, and who is responsible for collecting them? |
Rules can change by city, county, and even by building. Some listed properties are running without permits. Others are grandfathered in under older rules. Some may be violating local ordinances outright. That means a market can look strong in the data and still be a bad buy for your exact property.
So don’t stop at market-level numbers. Confirm the property type is allowed, confirm the exact address or zoning district qualifies, and confirm every tax and licensing rule before underwriting.[16][17]
Safety, Access, and Nearby Demand Drivers
This is where neighborhood analysis gets more grounded. Two areas can post similar occupancy and ADR, yet perform very differently in practice. The difference often comes down to what actually brings guests there: walkability, parking, airport access, hospitals, universities, employers, stadiums, and event venues.[13][11][14]
Guests aren’t paying for generic city access. They’re paying to stay near places they plan to use. Research shows that Airbnb listings cluster most heavily near restaurants, bars, cultural attractions, beaches, universities, shopping centers, and rail transit.[11][14]
The guest use case matters. A neighborhood near a hospital corridor may keep midweek occupancy steady because of traveling nurses and medical visitors. A neighborhood near a stadium or event venue may see spikes on event weekends. That’s a lot more useful than calling an area a "good location" and leaving it at that.
Reviews can help here too. Scan nearby listings and look for repeat mentions of parking, safety, walkability, and ease of access. Those patterns often explain why guests pick the area. On the flip side, repeated complaints about noise, weak parking, confusing access, or safety issues can drag down future bookings or force lower nightly rates. Research based on nearly 5 million Airbnb reviews found that a single safety-related review is associated with an occupancy drop of roughly 1.5 to 2.4 percentage points and a price decline of about 1.5% afterward.[12]
The best-performing neighborhoods usually have several demand drivers that stay in place outside peak season, not just one event venue or a short-term burst of interest.
Once these drivers look solid, verify the neighborhood with live comps and STR analytics tools.
Where to Get Airbnb Neighborhood Data and How to Use It
Once a neighborhood passes your risk screen, the next step is simple: verify it before you make an offer. That means checking live Airbnb comps against past market data. Relying on just one source can lead you off course. Live listings show what’s happening now. STR platforms show the pattern behind it.
Manual Comp Analysis from Live Airbnb Listings
Start with Airbnb itself.
Match the property as closely as you can by property type, bedroom count, guest capacity, and the amenities that actually change the nightly rate. Search using the target ZIP code or neighborhood, then apply filters that mirror your subject property. In cities, use about a 0.5 to 1 mile radius. In suburban or vacation markets, widen that to 1 to 3 miles.
Focus on listings with similar design level and a similar guest profile. If you’re buying a family-friendly three-bedroom home, don’t compare it to a luxury couples’ retreat just because it’s nearby. Live comps help set your offer price. This isn’t just background research.
Keep the map radius tight, pull 15 to 30 close comps, and watch how fast their calendars fill over 3 to 4 weeks. Set search dates for an upcoming weekend, sort by price, and throw out the extreme high and low listings. Record each nightly rate, then use the median as your benchmark.[18][19]
Next, scan each listing’s next 60 to 90 days. Count blocked nights versus open nights to estimate occupancy. It’s not perfect, but it gives you a solid read. Minimum-stay rules can also tell you a lot. A two-night minimum may point to weekend travelers. A five- or seven-night minimum may suggest family trips or vacation guests.
Then look past the numbers.
Check the photo quality, layout, bed setup, and the amenities guests care about in that market. Read reviews with intent. Look at review count, how recent they are, and rating patterns over time. Strong ratings plus a steady flow of recent reviews often point to better demand and tighter operations.
Add notes to your spreadsheet for details that numbers miss, like:
- complaints about parking, noise, or check-in friction
- praise for walkability, cleanliness, or host communication
That context matters. A well-staged home with strong reviews and pro-level photos can outperform market ADR. If your plan is more middle-of-the-road on furnishing and photography, trim your revenue projection compared with the top comps.
Use analytics tools next to see whether what you’re seeing in those listings reflects a real market pattern.
Using STR Analytics Tools to Confirm Neighborhood Trends
Manual comps show you the street-level picture. STR analytics tools show you the track record behind it.
AirDNA, Mashvisor, Rabbu, and PriceLabs each show neighborhood data a little differently. Use them to check occupancy, ADR, RevPAR, supply growth, booking window, and length of stay. Then compare those numbers with your manual comp sheet.
If the gap is big, one of two things is probably happening: your comp set is off, or the tool doesn’t cover that market well.
That’s normal. Different platforms use different models, so their neighborhood estimates won’t line up exactly. Treat the outputs as a range, not a single hard truth. When tools disagree, lean toward the figures that line up with live comps and the most recent data.
At that point, turn the data into a simple pass-fail scorecard before you start underwriting.
Building a Neighborhood Scorecard Before Making an Offer
Once you have both sets of data, put everything into one comparison table. This keeps you from getting stuck on the neighborhood you happened to study most closely.
| Neighborhood | Occupancy | ADR ($) | RevPAR ($) | Supply Trend | Regulation Risk | Notes |
|---|---|---|---|---|---|---|
| Downtown West | 68% | $225 | $153 | Moderate growth | Medium | Strong weekend demand; design upgrade needed. |
| Lakeside District | 72% | $210 | $151 | Stable | Low | Family-oriented, longer stays; HOA rules manageable. |
| University Corridor | 60% | $180 | $108 | Rapid new listings | High | Good weekday demand; city debating stricter STR limits. |
Set your thresholds before you compare neighborhoods. That part matters. If regulation risk is high or unclear, it can outweigh solid occupancy and ADR.
Use the scorecard to shape three things:
- your offer price
- your reserve target
- your risk limits
For complex rules or multi-market growth, Rank One Stays can translate neighborhood data into compliant pricing, operations, and investor-ready assumptions.
Use the scorecard to build your revenue and expense plan next.
Turning Neighborhood Data Into a Cash-Flow Plan
Once you’ve picked the winning neighborhood, the next step is simple: turn that scorecard into a conservative cash-flow model.
This is where a neighborhood has to prove itself. You underwrite one area based on projected revenue, expected expenses, and what happens if things go worse than planned. If the numbers only work in a rosy scenario, the neighborhood doesn’t make the cut.
Estimating Annual Revenue, Expenses, and Downside Scenarios
Annual revenue = available nights × occupancy × ADR.
Let’s say neighborhood comps show an ADR of $220 and average occupancy of 68%, and you expect to operate the property for 340 nights per year. That gives you about 231 booked nights and $50,820 in gross annual revenue. If you plan to block off nights for personal use or maintenance, subtract those dates before you run the math.
Then back out operating costs, including:
- Cleaning and turnover: $80–$200 per stay
- Utilities: $200–$500 per month
- Supplies and amenities: $100–$250 per month
- Taxes and permit costs: market-specific
- Insurance: $1,500–$4,000 per year for well-insured STRs
- Maintenance reserve: 8%–12% of gross revenue
- Management fee: use the operator’s rate
- Debt service: monthly mortgage payment
After that, pressure-test the deal.
Model a downside case with 10%–15% lower ADR and 10 percentage points lower occupancy. In this example, gross revenue falls to about $37,430. Run that lower revenue figure through the full expense model and see if debt service is still covered. Only move forward if the deal works under strain, not just when everything goes right. [23][24]
DIY Analysis vs. Professional Management Execution
If the model works on paper, execution is what makes it work in the field.
Your underwriting depends on ADR and occupancy. Those numbers don’t just happen. They come from pricing, operations, guest service, and day-to-day follow-through.
Self-managing means you handle pricing, guest messages, cleaning schedules, maintenance, and lodging tax reporting yourself. In many cases, that’s several hours each week, including evenings and weekends.
Professional management hands those jobs to an operator. Yes, there’s a management fee. But the revenue lift can outweigh that cost. Dynamic pricing, based on STR analytics, comp set data, and booking pace, can increase annual revenue by 10%–30% compared with casual manual price changes. [21][22] In the Wyndham vacation rental network, a dynamic pricing approach used across two regions drove 3.5% and 5.2% revenue-per-unit growth during part of the 2018 season, even inside an already-optimized portfolio. [20]
| Task | DIY Owner | Professional Management | Time Demand (Owner) | Revenue Impact |
|---|---|---|---|---|
| Dynamic pricing & rate strategy | Manual adjustments; basic platform tools | STR analytics, comp sets, and algorithms | High | High: can materially raise annual revenue |
| Calendar & minimum-stay management | Manually block dates and adjust stay rules | Seasonal pricing and minimum-stay logic | Moderate to high | Moderate to high: improves utilization of peak demand |
| Guest communication & support | Owner responds directly, including nights/weekends | 24/7 support team with standardized workflows | High | High: improves reviews and repeat bookings |
| Housekeeping & turnover | Owner schedules and inspects cleaners | Managed cleaning teams with quality control | Moderate to high | Moderate: fewer missed cleans, better guest satisfaction |
| Maintenance & vendors | Owner finds and coordinates vendors | Established vendor networks and proactive maintenance | Moderate | Moderate: reduces downtime and negative reviews |
| Design, staging & setup | DIY furnishings based on personal taste | Professional staging tuned to ADR goals | High upfront | High: upgraded design can materially increase ADR |
| Financial reporting & tax support | Owner-built spreadsheets | Monthly statements and lodging tax support | Moderate | Low to moderate: better visibility, fewer compliance gaps |
Rank One Stays handles these tasks end to end for investors nationwide, with local expertise in Scottsdale, Denver, Pittsburgh, and Lighthouse Point, Florida. Management fees start at 10%, and owner partners earn 38% more revenue than the market average.
Conclusion: How to Choose a Stronger Airbnb Neighborhood
The best neighborhood isn’t the one with the flashiest top-line numbers. It’s the one that still works after stress-testing.
Pick the neighborhood that clears your occupancy, ADR, regulation, and downside thresholds.
If you want full-service management, Rank One Stays also offers vacation rental design and staging to help your listing compete at the top of the comp set from day one, along with end-to-end management for pricing, guest support, housekeeping, lodging tax support, and damage claims.
FAQs
How many comps should I analyze before buying?
Analyze at least 10 similar properties within a 1-mile radius of your target investment.
That gives you a solid baseline for the local market. Once you compare your projected fixed costs and profit margin against those comps, it becomes much easier to see whether your numbers make sense.
If you want to avoid constant comp tracking and pricing changes, many investors partner with Rank One Stays for listing optimization and dynamic pricing.
What occupancy rate is good for a first Airbnb?
For a first-time Airbnb investor, 65% to 80% occupancy is common for urban apartments. Larger vacation homes tend to swing more from month to month.
In your first 30 days, focus on occupancy before total revenue. New listings usually start with less visibility and no reviews, so it often helps to price them 10% to 20% below the market average to build search ranking.
How do I verify if a property is legally allowed?
Check the local city or county zoning department, municipal code, and zoning maps to confirm whether short-term rentals are allowed in that property’s district.
You’ll also want to verify any needed permits or business licenses. Some areas limit the number of licenses available or ban non-owner-occupied rentals altogether.
If the local rules feel like a maze, Rank One Stays can help owners stay compliant in Scottsdale, Denver, Pittsburgh, and Lighthouse Point.