
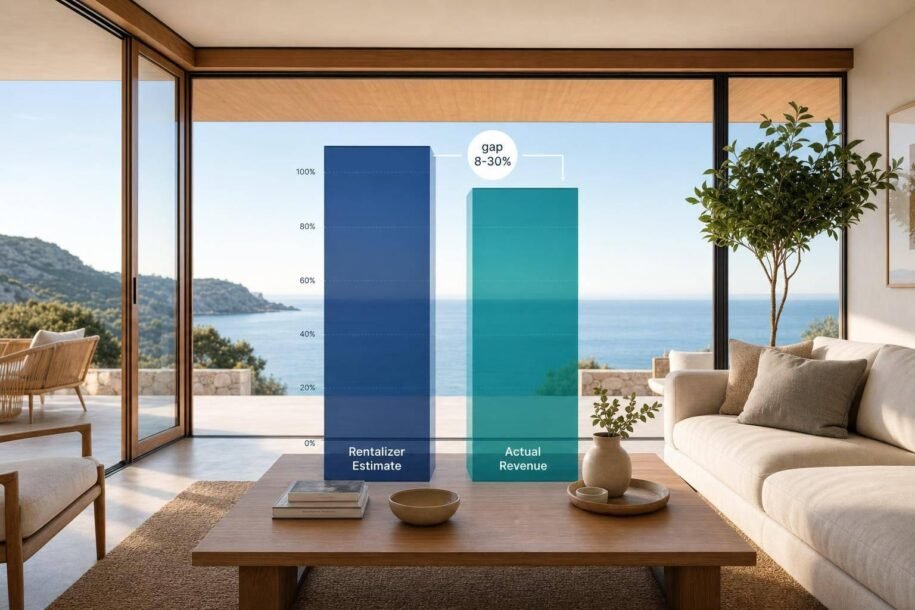
AirDNA Rentalizer is a starting number, not a promise. If you use it to buy, price, or judge a short-term rental, the main question is simple: how close will that estimate be to the money you actually bring in?
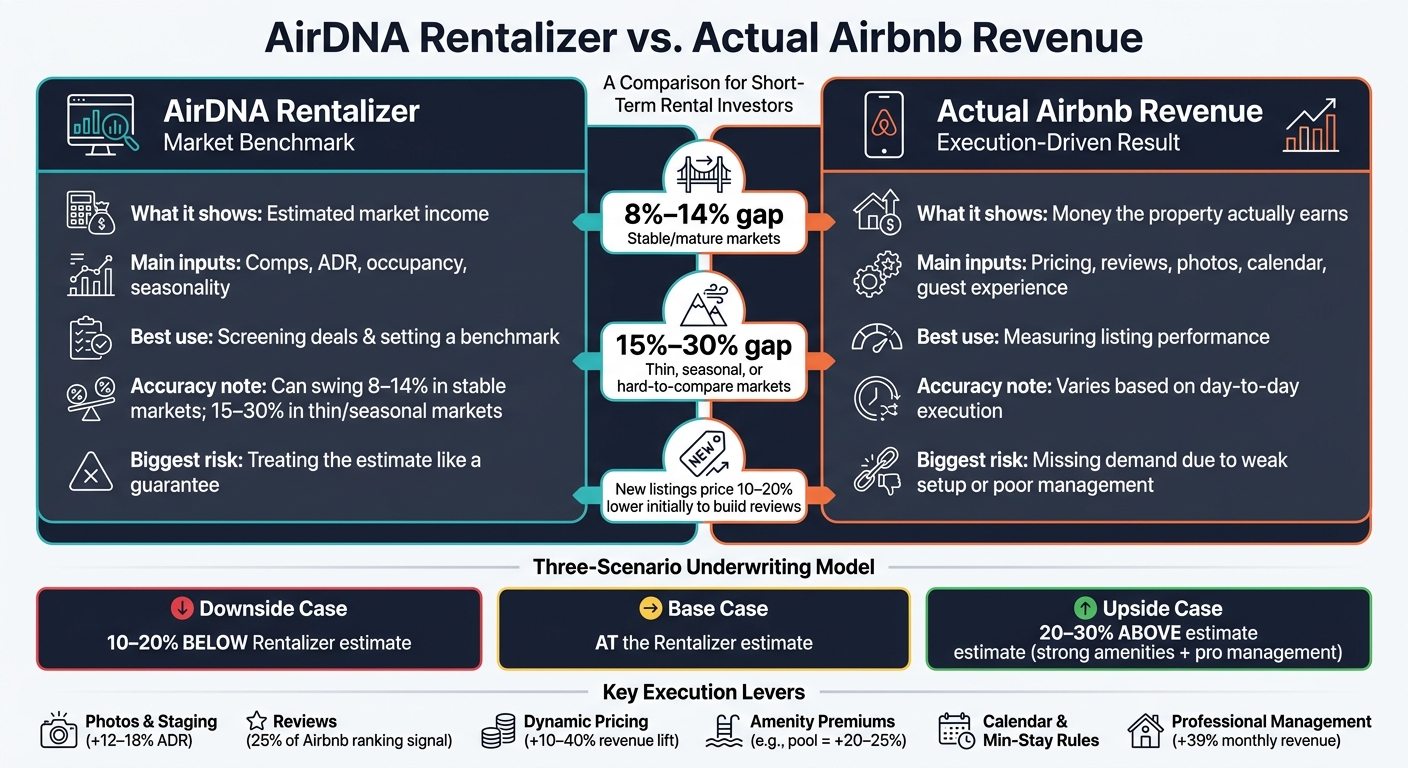
My short answer: it can be close in stable markets, but it can also miss by 15% to 30% in thin, seasonal, or hard-to-compare areas. In many steady markets, the gap is often around 8% to 14%. That difference usually comes from a few things:
- ADR
- Occupancy
- Seasonality
- Amenity premiums
- Photos, reviews, and pricing
- Blocked dates and minimum-stay rules
Here’s the core idea in plain English:
- Rentalizer looks at comps and market data
- Actual revenue depends on how well you run the listing
- Strong listings can beat the estimate
- Weak listings can fall below it
- New listings often need to price 10% to 20% lower at first to build reviews
- Professional property management can change the outcome, but the fee has to work with your math
If I were using Rentalizer, I would not underwrite from one number alone. I’d run:
- a downside case at 10% to 20% below the estimate
- a base case at the estimate
- an upside case at 20% to 30% above the estimate if the home has strong amenities and tight day-to-day execution
Quick Comparison
| Topic | AirDNA Rentalizer | Actual Airbnb Revenue |
|---|---|---|
| What it shows | Estimated market income | Money the property actually earns |
| Main input | Comps, ADR, occupancy, seasonality | Pricing, reviews, photos, calendar, guest experience |
| Best use | Screening deals and setting a benchmark | Measuring listing performance |
| Accuracy | Often close, but can swing by market | Changes based on execution |
| Common gap | 8% to 14% in steadier markets; 15% to 30% in thinner or seasonal ones | N/A |
| Biggest risk | Treating the estimate like a guarantee | Missing demand because of weak setup or poor management |
If you want one takeaway, it’s this: use Rentalizer to read the market, then judge the property on execution. That’s where the revenue gap usually starts.
AirDNA Rentalizer vs Actual Airbnb Revenue: Key Differences & Gap Ranges
AirDNA Rentalizer vs. actual Airbnb revenue: where the numbers diverge
How Rentalizer builds a projection from comps and seasonality
Rentalizer starts with nearby comps and then adds ADR, occupancy, and seasonality into the forecast [2]. That gives owners a useful starting point. But the estimate gets less exact when the comp set is thin, out of date, or mixed across property types and amenity levels [2].
There’s also a simple limit here: a model can’t fully “see” the parts of a listing that drive guest choice in practice. Photos, copy, reviews, response speed, and guest satisfaction all shape booking performance, yet those factors sit outside what Rentalizer can directly measure [2]. So the tool sets a benchmark, not a promise. From there, the bigger issue is understanding why live revenue drifts away from that benchmark.
Typical variance ranges owners should expect
In mature markets, the gap is usually smaller. In thinner, highly seasonal, or very distinct markets, gaps of 15% to 30% are common, while most stable markets tend to fall within 8% to 14% of the estimate [5].
In plain terms, the spread usually shows up in a few places:
- ADR
- Occupancy
- Seasonality
- Amenity value
Those are the main pressure points where Rentalizer and actual performance split.
Why Pittsburgh and Scottsdale can produce different gaps
The same model can miss by very different amounts depending on how local demand works.
In Pittsburgh, demand can shift a lot at the neighborhood level. Hospitals, universities, and local events can push one pocket of the city far ahead of another, which means a broad citywide comp set may blur those micro-markets and miss the mark for a single property [5].
Scottsdale has a different pattern. Winter tourism, pool season, and golf travel create sharp swings across the year. On top of that, homes with pools can command 20% to 25% more than similar listings without them [5][6].
That’s why the next step is to separate the day-to-day levers that move performance. In most cases, the gap comes back to listing quality, reviews, pricing, availability, and management.
sbb-itb-103bddb
How to analyze an Airbnb using AirDNA in 2025 (My NEW strategy)
Why actual revenue lands above or below the Rentalizer estimate
The gap usually comes down to execution. Rentalizer shows market potential. But the way a listing is presented, priced, and managed is what shapes actual revenue.
Once you have the benchmark, the next part is simple to say and harder to do: execution decides whether a listing beats it.
Listing design and photos affect ADR faster than models can track
Rentalizer builds its estimate from comparable listings, but comps are still averages. Airbnb also ranks listings against nearby competitors, which means a decent property can still lag if nearby listings have better photos, stronger titles, or more appealing amenities [1]. Professional photography can increase bookings and ADR [3]. Professional staging can also increase ADR by 12–18% and guest bookings by 34% [8].
Why does this happen? Because guests often make their first decision with their eyes. The first photo gets the click or gets ignored. As Maverick STR puts it:
"If your photos look like a $150/night rental, guests will resist paying $250, even if your amenities justify it." [6]
That’s the whole game in one sentence. If a unit feels generic, it often has to cut rates to stay in the race, even when it looks close on paper to better-performing listings. Design and staging can do a lot of work here. They’re some of the highest-leverage ways to close the gap.
And that gap doesn’t stop at clicks. It tends to spill into reviews, search position, and occupancy.
Reviews, response speed, and guest experience drive occupancy
Reviews make up roughly 25% of Airbnb’s ranking signal [1]. So a property with a 4.9+ rating and a strong review count is more likely to rank well and compete on quality instead of price. Superhost status can also lead to a 22% revenue uplift on average [3].
The other side matters just as much. A new listing, or one with day-to-day friction, can trail Rentalizer even when demand is there. Slow replies, uneven cleaning, or guest complaints that don’t get fixed can hold a property back before pricing even enters the picture. Response times under one hour and strong review quality are critical for search visibility and occupancy [7].
When demand exists but revenue still falls short, the issue is often capture, not market size.
Pricing strategy, availability, and management determine whether demand gets captured
Even a strong listing can underperform when pricing and calendar management are too passive. Dynamic pricing software usually drives a 10% to 40% revenue lift over manual pricing [7], but that only works when the base rate starts in the right place and changes with market conditions.
Calendar control matters too. A rigid 7-night minimum stay during shoulder season can leave scattered empty nights that never get booked. Dropping to a 1- or 2-night minimum for last-minute gaps, while keeping longer minimums on peak dates, is a simple way to pick up revenue that would otherwise vanish [6].
Professional management helps close that gap through:
- Dynamic pricing
- Guest support
- Housekeeping
- Calendar control
In markets like Pittsburgh and Scottsdale, where micro-market demand and seasonal swings already create wide variation, execution at the property level is often what separates listings that beat the Rentalizer estimate from the ones that miss it.
How to use Rentalizer when buying or improving a short-term rental
Once you know the gap comes from execution, use Rentalizer as your market floor, not your goal.
Underwrite deals with a revenue range, not a single number
Run every deal with three cases: downside, base, and upside. Before you buy, model a downside case at 10%–20% below the Rentalizer estimate for the first six months, a base case at the estimate, and an upside case at 20%–30% above it if you expect pro management and top-tier amenities [1][4][2]. If the deal only works in the base case or better, the risk is higher than it may look at first glance.
The downside case matters most in year one. New listings with fewer than 10 reviews often need to price 10%–20% below similar nearby listings just to build review velocity and search rank [1]. That ramp is real. And when a Rentalizer projection looks neat and certain, it’s easy to gloss over it.
Treat amenity premiums as upside, not as your starting point.
Audit current performance using ADR, occupancy, reviews, and blocked dates
If you already own the property, start with the trailing 12 months. If revenue is below the Rentalizer estimate, don’t shrug it off. Use the gap to figure out what’s broken. Pull your trailing 12-month revenue, compare it with the current Rentalizer output, and look at where the miss is coming from.
High occupancy but low revenue usually means an ADR issue. You’re filling nights, but at prices that are too cheap. Low occupancy with a decent ADR often points to the listing itself: weak photos, too few reviews, or a cleaning fee that turns people away. Blocked dates and strict minimum stays can also chip away at revenue without making much noise.
One benchmark helps here: if occupancy is below 75% of your local comp set and your review score is behind, the property needs work on the operations side before a pricing tweak will do much [4].
When professional management can close the revenue gap
If pricing and presentation don’t fix the gap, management is the next lever. Some problems are hard to solve on your own. Remote ownership is the clearest example. If you live more than a couple of hours away, slow maintenance and uneven turnovers tend to show up in reviews sooner or later. And reviews drive about 25% of Airbnb’s ranking signal [1].
Other warning signs are pretty common too: stale listing photos, weak pricing rules, or no real calendar plan. At that point, the issue usually isn’t effort. It’s time, systems, and know-how.
Professionally managed listings have earned 39% more monthly revenue and 43% higher ADRs than self-managed properties [4]. That spread is big enough that full-service fees – usually 20% to 35% of gross revenue – can still make sense on the math [4]. When execution problems stick around, Rank One Stays can help close the gap with listing optimization, dynamic pricing, guest support, housekeeping, damage claims, and staging. Owners who partner with Rank One Stays earn 38% more revenue than the market average.
Conclusion: use Rentalizer to read the market, then win at the property level
AirDNA Rentalizer is a market benchmark, not a revenue promise. It shows what the market can support, but it can’t tell you how your exact listing will stack up. That difference comes down to execution.
Once you have the benchmark, the rest is about how well you run the property. Photos, reviews, pricing, and day-to-day management shape whether a listing gets the demand Rentalizer points to. The aim is simple: get the most revenue from every open night.
That gap doesn’t look the same everywhere. In Pittsburgh, shifts in demand by neighborhood can make a broad comp set miss the mark for one home. In Scottsdale, seasonality and amenity premiums like pools can create a big spread between listings in the same city. In both markets, it helps to manually check your comp set against listings with the same property type, guest capacity, and amenity tier. Then compare your listing against those comps on photos, reviews, pricing rules, and calendar setup.
If those levers are tough to fix in-house, management becomes the next factor. Rank One Stays can help close the gap with listing optimization, dynamic pricing, guest support, housekeeping, and damage claims.
Read Rentalizer as the market signal, then win on the property itself.
FAQs
How accurate is Rentalizer in my market?
Rentalizer can help with forecasting, but the output is only as good as the data behind it. It can show things like market pacing, supply growth, and occupancy trends. But it is not a pricing tool.
That distinction matters. A projection is based on market averages, and averages don’t tell the whole story. They don’t account for your property’s listing quality, photos, reviews, or how well it’s managed.
So your actual revenue could come in above or below the estimate. Two homes in the same market can perform very differently, even if they look similar on paper.
A common reason? Many self-managed properties fall short because they rely on static pricing and inefficient management.
Why is my Airbnb revenue lower than Rentalizer?
Rentalizer gives you an estimate. But your actual Airbnb revenue will depend on what’s happening in the market right now and how well your property performs.
That gap can come from things a tool like this can’t fully judge, such as your photos, reviews, pricing approach, and how well the place is managed.
And those details matter more than they might seem at first glance.
A small drop from 5.0 to 4.9 stars can cut your average daily rate by 10%. On top of that, static pricing can leave 30% to 50% of revenue on the table.
When should I hire professional management?
Hire professional management when running the day-to-day stuff yourself stops making sense.
That’s often the case if you own more than one property, live over 30 minutes away, or spend more than 10 hours a month dealing with guest messages, pricing, and turnovers.
It can also be a smart move if occupancy is stuck below about 65%–70% or if you’re leaving money on the table because of slow reply times or weak pricing.
Rank One Stays handles the work that tends to eat up your time:
- Pricing
- Listing optimization
- Guest support
- Cleaning and maintenance
- Reviews