
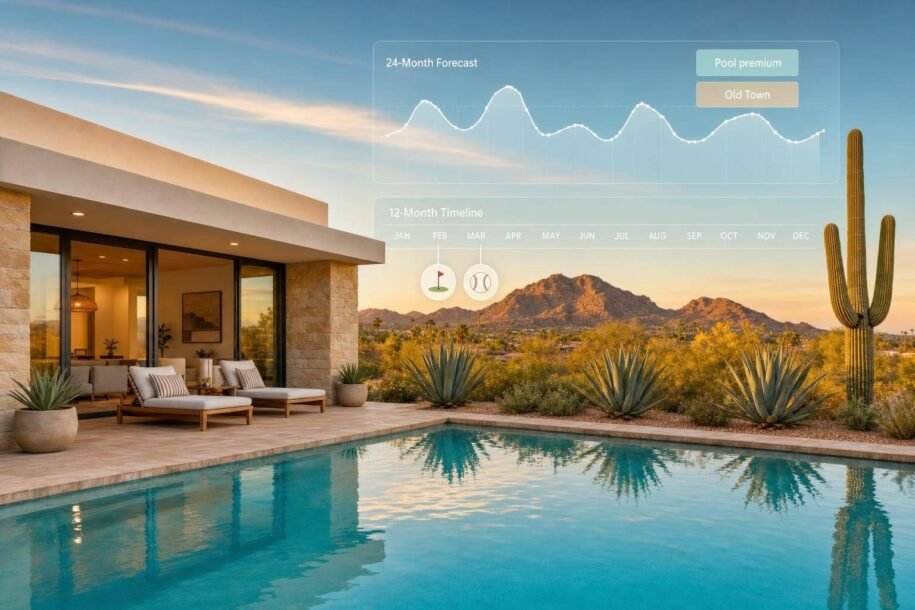
If I want a Scottsdale Airbnb forecast I can use, I need monthly data, not a rough yearly guess. In this market, high season usually runs from October to April, summer demand drops hard in June to August, and event weeks like the WM Phoenix Open can skew a whole month if I don’t separate them out.
Here’s the short version:
- I start with 12 to 36 months of history
- I track occupancy, ADR, RevPAR, and monthly revenue
- I build a monthly seasonality index
- I split out event-driven spikes from normal demand
- I adjust for pool, neighborhood, and property type
- I review the forecast weekly, monthly, and quarterly
A few numbers shape the plan fast:
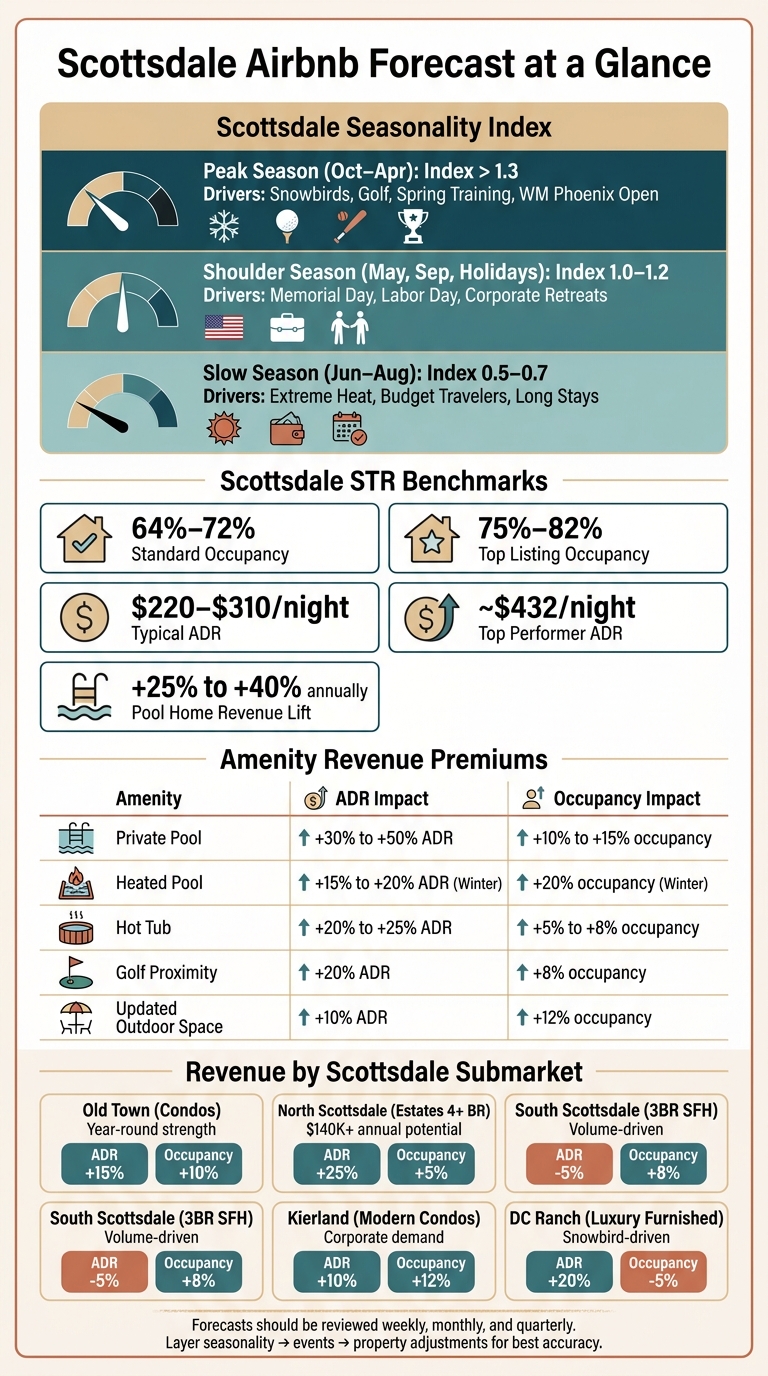
- Standard occupancy often sits around 64% to 72%
- Top listings can reach 75% to 82%
- ADR often falls between $220 and $310
- Top performers can reach about $432 ADR
- Pool homes may bring in 25% to 40% more annual revenue
What this means for me is simple: a Scottsdale forecast works best when I build it in layers. First, I map seasonality. Then I add event weeks. Then I adjust for the home itself. That gives me a forecast tied to how Scottsdale bookings move in real life, month by month.
Scottsdale Airbnb Revenue Forecast: Seasonality, Amenities & Neighborhood Adjustments
Build a Scottsdale Baseline from Historical Seasonality
Use historical monthly data because Scottsdale demand swings hard by season.
Use 12 to 36 Months of Booking Data to Map Monthly Demand
Pull your monthly occupancy rate, ADR, RevPAR, and average length of stay (ALOS) from your property management system (PMS) or Airbnb Insights [4]. RevPAR is the best baseline metric here because it combines pricing and occupancy in one number [4].
Set the data up by month and year, not as one annual total. That makes it much easier to spot patterns that come back year after year. Use 12 to 36 months of data so you can separate normal seasonality from one-off noise [3].
In Scottsdale, October through April is peak season. Demand is high, nightly rates go up, and occupancy tends to follow [3]. June through August flips that pattern. Extreme heat keeps many leisure travelers away, so demand leans more toward budget travelers and longer-stay guests [3]. May and September, plus holiday weekends, usually land in the middle with moderate demand [3].
Static pricing tends to miss the mark in a market like this.
This baseline gives you a picture of normal demand before you account for Scottsdale’s recurring surges. From there, you can layer in golf, spring training, and event weeks that push revenue above the monthly norm.
Calculate a Simple Monthly Seasonality Index
Once your monthly data is organized, build a seasonality index by comparing each month’s RevPAR to the annual average [4]. An index of 1.0 means the month is performing at the yearly average. An index of 1.5 means demand is 50% above average, while 0.6 means it is 40% below average [4].
A simple month-by-month baseline for Scottsdale often looks like this [3][4]:
| Season | Months | Demand Drivers | Typical Index Range |
|---|---|---|---|
| Peak | Oct – Apr | Snowbirds, golf, Spring Training, Waste Management Open | > 1.3 |
| Shoulder | May, Sep, holiday weekends | Memorial Day, Labor Day, corporate retreats | 1.0 – 1.2 |
| Slow | Jun – Aug | Extreme heat, budget travelers, longer-stay guests | 0.5 – 0.7 |
Use this index as your starting point before adding event, neighborhood, and property-level adjustments. It sets the base forecast before you factor in pools, neighborhoods, and property type.
sbb-itb-103bddb
Layer In Golf, Spring Training, and Event-Driven Demand Spikes
Use your monthly baseline, then add date-specific premiums for Scottsdale’s repeat event weeks. The main drivers are golf, spring training, and big-ticket event periods.
Map Recurring Demand Drivers on an Annual Event Calendar
Scottsdale has a steady lineup of annual events that push demand into short windows [3][2]. Barrett-Jackson Auto Auction runs in January and brings in high-spend collectors. The WM Phoenix Open lands in February and creates the tightest supply crunch of the year. Cactus League Spring Training keeps March busy with families and sports fans. The Scottsdale Arabian Horse Show also takes place in February, adding a smaller but still profitable bump during an already packed month.
Track each event by date, nearby neighborhoods, and usual booking lead time. The national median booking lead time is about 29 days, but major Scottsdale events often get bookings 45 to 90+ days in advance [4]. If your home is near WestWorld or TPC Scottsdale, start pushing rates up 45 to 90 days ahead [3][4].
Turn Past Event Performance Into Forecast Premiums
Look at event weeks against non-event weeks in the same month, then apply that premium only to those dates [3]. That’s the cleanest way to avoid inflating your whole month just because one week went nuts.
Dynamic pricing tools can do this for you, but they still need guardrails. Set minimum and maximum rate limits so the tool doesn’t price your home too low [4].
| Event | Typical Timing | Demand Type |
|---|---|---|
| Barrett-Jackson Auto Auction | January | ADR spike |
| WM Phoenix Open | February | Deepest supply squeeze |
| Scottsdale Arabian Horse Show | February | Short luxury spike |
| Cactus League Spring Training | March | Longer stay demand |
After event premiums, adjust the forecast for pools, neighborhood, and property type.
Adjust Revenue Forecasts for Pools, Neighborhoods, and Property Type
After event weeks, tighten the forecast around what your property can earn. A citywide average only gets you so far. Once you’ve built a baseline and added event premiums, the next move is to narrow the estimate based on the home itself, its amenities, and where it sits.
Measure Pool and Amenity Premiums from Past Results
Start with a comp set of 8 to 15 properties within a 1- to 2-mile radius that have similar bedroom counts and guest capacity. Then compare their RevPAR against yours, since RevPAR reflects both nightly rate and occupancy [1][3].
That comp set helps you put a number on pool lift. In Scottsdale, pool homes often bring in 25% to 40% more annual revenue [3]. Heated pools tend to matter more in winter, and hot tubs plus outdoor upgrades can push revenue higher too. Use the ranges below as a starting point [3][6].
| Amenity | Est. ADR Impact | Est. Occupancy Impact |
|---|---|---|
| Private Pool | +30% to +50% | +10% to +15% |
| Heated Pool | +15% to +20% (Winter) | +20% (Winter) |
| Hot Tub | +20% to +25% | +5% to +8% |
| Golf Proximity | +20% | +8% |
| Updated Outdoor Space | +10% | +12% |
These are just starting assumptions. Your own comp set should shape the final premium. And there’s a catch: weak Cleanliness or Value scores can wipe out those amenity gains [6].
Refine Assumptions by Scottsdale Neighborhood and Guest Profile
Scottsdale submarkets don’t move in lockstep, so use your past bookings and nearby comps to set each adjustment [3][5]. Property type changes the math too.
A 5-bedroom estate in North Scottsdale aimed at golf groups or multi-generational families can generate over $140,000 annually [3]. A 1-bedroom Old Town condo aimed at couples or solo business travelers usually lands in the $28,000 to $38,000 range [3].
Snowbird demand adds another layer. These are furnished stays of 30 or more nights from October through April, and in North Scottsdale, furnished leases can fetch $4,000 to $8,000 per month during that stretch [5].
Apply Neighborhood and Property-Type Adjustment Factors
Once you know the submarket and property type, apply those changes directly to the citywide baseline. Think of the table below as a set of starter multipliers, then tighten them with your own historical data [3][5].
| Neighborhood | Property Type | ADR Adjustment | Occupancy Adjustment | Revenue Impact |
|---|---|---|---|---|
| Old Town | Condos / Townhomes | +15% | +10% | Strong year-round |
| North Scottsdale | Large Estates (4+ BR) | +25% | +5% | High ADR, longer stays |
| South Scottsdale | Single Family (3 BR) | -5% | +8% | Volume-driven |
| Kierland | Modern Condos | +10% | +12% | Steady corporate demand |
| DC Ranch | Luxury Furnished | +20% | -5% (longer stays) | Snowbird-driven |
Use these as multipliers on top of your monthly baseline, not instead of it. Say your citywide 3-bedroom baseline shows $6,500 in February revenue. If the property is a North Scottsdale large estate with a private pool, you’d adjust that number up by about 25% for the neighborhood, plus another 25% to 40% for the pool. That leads to a very different forecast than the raw city average.
Apply those multipliers to monthly targets, then use pricing tools to keep the numbers current.
Turn the Forecast Into a Working Revenue Plan
Once you have your baseline and event premiums, the next step is to turn them into a pricing routine you can use again and again. Scottsdale moves fast during peak season, golf trips, spring training, and big event weeks. A plan you set in January can look outdated by March.
Weekly (about 30 minutes): Check your future booking pace for the next 30 to 60 days. If a weekend is already sold out more than 30 days in advance, there’s a good chance your rates were too low. If more than 20% of your calendar is still open within 14 days of arrival, your rates may be too high, or your minimum-stay rules may be too tight. It also helps to price single-night gaps more aggressively and loosen minimum stays when it makes sense so you can pick up last-minute demand [4].
Monthly (about 1 hour): Compare your actual RevPAR with last month and the same month last year. Then look at your ADR against a comp set of 5 to 10 similar local properties. If RevPAR is behind, figure out what’s driving the gap before you change anything. Is it a rate issue? Or are you struggling with occupancy? That distinction matters when you adjust pricing or minimum stays [4].
"RevPAR balances both [occupancy and rate]… High occupancy alone does not guarantee high income; high rates alone can reduce bookings." – Ric Kenworthy, Travli Hospitality Co [1]
Quarterly: Run a 90-day variance check. Compare actual revenue with your forecast, then reset your assumptions, maintenance budgets, and upgrade plans [3][4].
Use Dynamic Pricing and Local Management Support to Improve Accuracy
These review checks should feed straight into your rate updates. Dynamic pricing tools can help lift ADR and revenue by adjusting rates based on demand, seasonality, and events. Airbnb Smart Pricing often sets rates too low because it leans toward booking volume instead of RevPAR [3][4]. Good pricing tools also make it easier to react to booking pace and seasonal swings before they hit your calendar [1].
Rank One Stays can manage dynamic pricing, forecast reviews, owner reporting, and staging for Scottsdale owners.
Final Summary: What to Review Before Trusting a Scottsdale Forecast
Before you trust the number, do one last pass. A solid Scottsdale forecast comes from layered data, checked in the right order.
Start with at least 12 months of history to ground the forecast.[3] That gives you a clear sense of what “normal” looks like before you layer in anything else.
Then split out recurring event windows from standard seasonality.[3][2] Big event periods can drive short-term rate jumps, and those jumps shouldn’t sit inside your baseline. Give them their own forecast premium instead.
After that, check pool and neighborhood premiums against nearby comps. Compare your forecast with similar homes in the same submarket so the estimate lines up with actual local conditions, not a citywide average.[3][6]
Last, treat the forecast like a living document. Booking pace can shift fast during peak season, so review your assumptions on a regular basis and adjust when the calendar starts filling faster than expected. If pricing reviews are slowing you down, Rank One Stays can take care of pricing reviews, data pulls, and owner reporting for Scottsdale owners.
FAQs
How do I build a monthly seasonality index for a Scottsdale Airbnb?
Track 12 months of ADR and occupancy first. That gives you a clear baseline to work from before you start making pricing calls.
From there, map Scottsdale’s main demand cycles:
- The busy October–April snowbird season
- Golf demand and Spring Training lifts
- The slower summer stretch
Then layer in event-driven spikes. Big events like the Waste Management Phoenix Open or Barrett-Jackson can send nightly rates to 2–4x your base rate, so your index should account for those jumps instead of treating them like normal demand.
It also helps to tighten your forecast by neighborhood and property type. A condo in Old Town won’t move the same way as a larger home near golf courses, and those differences matter when you’re setting rates.
How should I separate event spikes from normal seasonal demand?
Start with your local event calendar to spot demand drivers you already know about, like golf tournaments, sports seasons, or major concerts. Seasonal demand tends to follow broad patterns. Event-driven spikes are different. They create short bursts of market compression in very specific areas.
The smart move is to keep a baseline seasonal pricing strategy in place, then add more aggressive rate changes for high-impact event dates. Rank One Stays can automate those updates with real-time data.
Which Scottsdale neighborhoods and amenities affect revenue the most?
In Scottsdale, revenue swings most based on where the home sits and whether it’s positioned at the high end of the market. Premium pockets near Paradise Valley and in North Scottsdale, including Gainey Ranch and DC Ranch, pull in the strongest price premiums. The broader 85251–85262 area is also a high-demand, high-competition zone, driven by nightlife, golf, and events.
The amenity that moves rates the most is the private pool. In many cases, it can push nightly rates about 30% to 50% higher. Hot tubs, pickleball, and other upscale outdoor features also help. Bigger homes usually bring in more during peak months too.