
Airbnb analytics isn’t just for experts – it’s a tool every host can use to boost earnings. By tracking key numbers like occupancy rate, average daily rate (ADR), and revenue per available room (RevPAR), hosts can make smarter decisions about pricing, guest experience, and overall strategy.
Why it matters:
- Hosts using analytics can earn 20–40% more.
- High ratings (4.8+ stars) and fast responses (95% within 1 hour) improve visibility and bookings.
- Analytics can highlight trends, such as the best pricing windows or guest-preferred amenities.
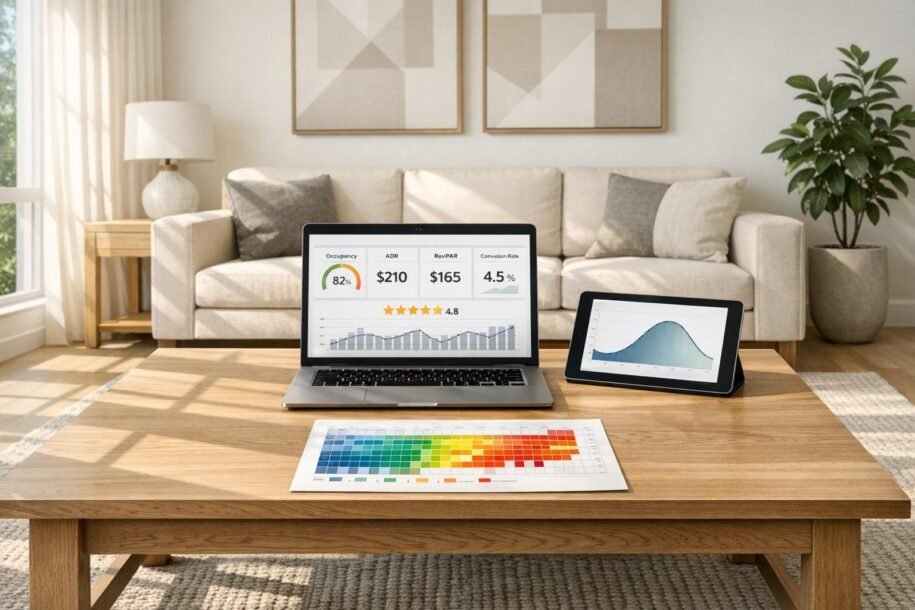
Key Metrics to Track:
- Occupancy Rate: Shows the percentage of booked nights.
- ADR (Average Daily Rate): Your average earnings per night booked.
- RevPAR (Revenue Per Available Room): Combines pricing and occupancy into one number.
- Booking Conversion Rate: Tracks how many inquiries turn into bookings.
- Guest Review Scores: High ratings improve rankings and attract more bookings.
Tools to Use:
- Airbnb’s Dashboard: Offers performance tracking and financial insights.
- Third-Party Tools: AirDNA, PriceLabs, and Mashvisor provide deeper market data.
If managing analytics feels overwhelming, professional vacation rental management can handle pricing, guest support, and strategy for you, often increasing revenue by nearly 38%. Whether you’re a single-property host or managing multiple listings, leveraging data is the key to thriving in the competitive short-term rental market.
How to Analyze an Airbnb Market Like a Pro (Avoid These Common Mistakes)

sbb-itb-103bddb
Key Airbnb Metrics Every Host Should Track

5 Essential Airbnb Metrics Every Host Should Track
Keeping tabs on the right metrics can mean the difference between guessing and growing your earnings as an Airbnb host. Here are five key numbers that reveal how your listing is doing and where there’s room to improve.
Occupancy Rate
Occupancy rate measures the percentage of nights your property is booked. To calculate it, divide the number of booked nights by the total available nights, then multiply by 100. For example, 24 booked nights out of 30 equals an 80% occupancy rate. This metric highlights demand for your property, but it’s not the whole story. High occupancy doesn’t always mean high profits. In some cases, professional property management can help balance these metrics to optimize your bottom line. A 2024 Minnesota analysis showed Plymouth properties with 80% occupancy at $112 per night earned about $24,000 annually. Meanwhile, Eden Prairie properties, with only 46% occupancy but a $180 nightly rate, brought in $30,000 annually – $6,000 more despite fewer bookings [3].
Average Daily Rate (ADR)
ADR reflects your average earnings per booked night, giving insight into your pricing strategy and how much guests are willing to pay [3][1]. To calculate it, divide your total revenue by the number of nights booked. For instance, if you make $3,360 from 24 bookings, your ADR is $140. Comparing your ADR to similar properties in your area can help you identify pricing opportunities. As SummerOS points out, "Improving your ADR without lowering occupancy means more revenue without more work" [3]. In cities like Denver, ADRs often spike during ski season, while properties in Scottsdale see a peak during the winter months.
Revenue Per Available Room (RevPAR)
RevPAR combines occupancy and pricing into one key performance metric. It’s calculated by multiplying your ADR by your occupancy rate [3][1]. For example, an 80% occupancy rate with a $112 ADR results in a RevPAR of $89.60. In the same Minnesota analysis, Eden Prairie properties in the 50th percentile achieved a RevPAR of $87, while top performers in the 75th percentile reached $137. This shows how even within the same market, performance tiers can significantly impact earnings [3]. As Autohost explains, "A rising RevPAR indicates increasing profitability. If it’s declining, it’s a red flag to delve deeper into pricing or occupancy issues" [1].
Booking Conversion Rate
This metric tracks how many inquiries lead to actual bookings. If you receive 20 inquiries and secure 5 bookings, your conversion rate is 25%. A low rate often points to issues with pricing or the appeal of your listing. Quick responses can help improve this number, as guests are more likely to book when hosts reply promptly [7].
Guest Review Scores and Response Time
Guest reviews influence both your reputation and your Airbnb search ranking. Pay attention to your overall rating and specific categories like cleanliness and check-in experience to spot areas for improvement [6][1]. Response time and response rate are equally important. Response rate measures how often you reply within 24 hours, while response time tracks how quickly you respond. Maintaining a response rate of at least 90% can unlock features like Instant Book and improve your visibility on the platform [2]. Rachel Scott from Beyond Pricing emphasizes, "Maintaining a high response rate (at least 90%) is ideal – and even allows you to use other host features on the platform, like Instant Book, another feature that will improve your ranking" [2]. Hostify agrees, noting that "a prompt response time is typically associated with higher guest satisfaction and can positively impact booking conversions" [7].
Tools and Platforms for Airbnb Analytics
Airbnb’s Built-In Insights Dashboard
Airbnb provides a built-in dashboard packed with tools to help hosts track their performance across historical, real-time, and forecasted data [8]. The dashboard is divided into four main sections: Conversion, Occupancy & Rates, Quality, and Hosting Progress [8][5]. These sections allow you to monitor details like first-page search impressions, booking conversion rates, and wishlist additions [8][5].
The Earnings Dashboard is particularly useful for financial tracking. It breaks down gross earnings, deductions, and net pay. You can also view a chart that spans the last six months, the current month, and projections for the next five months [10]. While performance data updates every 24 hours, historical data is typically limited to the past 12 months [8][5]. For convenience, you can download custom CSV or PDF reports for specific date ranges, which can be a lifesaver during tax season or when planning finances [10].
If you manage multiple properties, the regional filter is a handy tool to analyze specific markets instead of viewing your entire portfolio at once [8]. A "similar listings" graph lets you compare your 5-star ratings and nightly rates with local competitors, helping you stay competitive [8]. Additionally, the "Today" tab highlights immediate tasks – like responding to guest requests or reviewing notes for upcoming reservations – which can directly impact your search visibility and response rate [11][1].
For hosts looking to go beyond Airbnb’s dashboard, third-party tools can provide even deeper insights into market trends and performance.
Third-Party Analytics Tools
Platforms such as AirDNA, PriceLabs, and Mashvisor offer powerful analytics tailored for Airbnb hosts, often at affordable monthly rates [12][13].
- AirDNA tracks data for over 10 million Airbnb and Vrbo listings worldwide, giving hosts a broad perspective on market trends [12].
- PriceLabs specializes in dynamic pricing, managing rates for over 600,000 listings across 150+ countries. Its Market Dashboard updates daily, ensuring hosts have access to the latest data [12][13].
- Mashvisor is a favorite among investors, helping compare long-term rental strategies with short-term ones [12].
It’s important to use multiple tools, as projections can differ by as much as 25% [12]. Reviewing monthly data instead of annual averages can also help you avoid cash flow issues during slower seasons [12]. The 10XBNB Guide emphasizes the importance of action over analysis:
"The best analytics tool is a signed lease with good numbers. Stop researching and start calling landlords" [12].
For hosts who want to take their analytics game to the next level, professional management services integrate these tools into their daily operations.
Using Professional Management Services
Professional management services take the insights from Airbnb’s dashboard and third-party tools and turn them into actionable strategies. These services use advanced analytics and dynamic pricing to adjust rates daily, factoring in real-time demand, local events, and seasonal trends. Unlike Airbnb’s one-year data limit, professional services often access up to five years of historical data, providing a broader perspective [1][3][5]. This data-driven approach can lead to hosts earning 20–40% more [4].
How to Use Analytics to Improve Listing Performance
Dynamic Pricing to Maximize Revenue
The key to effective dynamic pricing lies in demand tracking. Analytics tools can monitor competitor rates, local events, and market trends to automatically adjust your prices. This means you’ll stay ahead of demand shifts instead of scrambling to catch up [13][15].
Another essential tool is pacing intelligence, which compares your booking velocity to historical patterns. By analyzing lead times, you can tweak minimum stay requirements to balance last-minute bookings with long-term reservations [9]. For example, if your calendar fills up too quickly, it might be a sign your pricing is too low. On the other hand, if bookings are slower than last year but the entire market is down, it’s likely not an issue with your listing specifically.
Breaking down bookings by time frames, such as 0–3 days or 31–60 days, allows you to fine-tune last-minute discounts or premiums for advance reservations [14][9]. Use price floors and ceilings to protect your profit margins while letting pricing algorithms adjust within safe limits. Regularly review pricing reports – at least weekly – to spot anomalies or prepare for upcoming events that could impact demand [14][15][13]. For instance, if your occupancy consistently exceeds 85%, consider raising rates by 10–20%. If it’s below 50%, you might need to lower prices or improve your listing’s appeal [4].
Always keep an eye on RevPAR (Revenue Per Available Room), calculated as ADR (Average Daily Rate) multiplied by occupancy. High occupancy at very low rates might seem like a win, but it often results in reduced profits due to increased turnover costs [9][4].
"Revenue is vanity, profit is sanity. Many hosts celebrate high revenue while losing money." – Short-Term Rental Essentials [4]
Beyond pricing strategies, guest feedback offers valuable insights to enhance your overall hosting approach.
Improving Guest Experience Through Feedback
While pricing strategies drive revenue, an excellent guest experience ensures long-term success.
Star ratings are just the beginning – review patterns in guest feedback can highlight areas for improvement. For instance, repeated mentions of cleanliness, Wi-Fi issues, or parking challenges can guide your investments to improve future stays [3][1].
The numbers tell a clear story: listings with 10 or more reviews tend to outperform those with fewer reviews. For example, properties in Chicago with 10+ reviews achieve 70% occupancy, compared to just 36% for listings with no reviews [16]. In Los Angeles, listings with 10+ reviews see 72% occupancy, while properties with only 1–5 reviews average 61% [16].
A simple mid-stay check-in message – sent about two days into a reservation – can help address issues before they turn into negative reviews [16]. If a guest does leave feedback about a specific problem, publicly responding to confirm the issue has been resolved can build trust with future guests [16]. Use data from "Check-in" ratings to identify areas for improvement, like adding clearer instructions or upgrading to a smart lock system [16]. Properties in cities like Denver and Pittsburgh that prioritize guest feedback consistently outperform those that don’t.
Benchmarking Against Market Averages
Competitive benchmarking is a powerful way to determine whether your performance issues are specific to your listing or part of a broader market trend [17]. Start by identifying 20–30 comparable properties based on location, size, price range, and type. Compare key metrics like ADR, occupancy, and RevPAR to local benchmarks to see how you stack up.
For example, if your ADR is lower than similar listings but your occupancy is nearly 100%, it’s worth testing higher rates during peak demand periods [3]. Conversely, if your occupancy is higher than the market average, you might be pricing too low. Regularly reviewing your listing from a guest’s perspective can also help ensure you remain competitive. If market trends show guests booking later than usual, resist the urge to cut prices aggressively if your pacing aligns with the trend [17].
For property owners in areas like Scottsdale or Lighthouse Point, partnering with professional management services can provide access to advanced benchmarking tools and market insights that individual hosts might not have on their own.
Why Professional Management Can Improve Your Airbnb Investment
The Benefits of Full-Service Management
Professional management takes the guesswork out of running a short-term rental by turning data into real results. While self-managing often means juggling spreadsheets and relying on gut instincts, professional services use advanced analytics to track performance across regions and property types. This centralized approach provides insights that individual hosts typically can’t achieve on their own [9].
Take Rank One Stays as an example. They handle everything – from optimizing listings and setting dynamic pricing to providing 24/7 guest support, professional cleaning services, and managing damage claims. Instead of manually adjusting prices, hosts benefit from real-time data that adapts to demand trends, competitor rates, and booking patterns [13].
These services rely on algorithms that dynamically price over 600,000 listings in more than 150 countries every single day. The goal? To maximize revenue by balancing occupancy and rates. By focusing on metrics like Revenue Per Available Room (RevPAR), professional managers avoid common pitfalls such as underpricing during slow seasons or overpricing during demand spikes [14].
Real Results with Rank One Stays

Partnering with Rank One Stays often leads to higher earnings. On average, property owners see a 38% boost in revenue compared to the market standard, with management fees starting at just 10%. It’s not just about filling more nights – it’s about optimizing RevPAR to achieve sustainable profitability.
For instance, in Eden Prairie, properties with an Average Daily Rate (ADR) of $180 and a 46% occupancy rate brought in $30,000 annually. That’s $6,000 more than comparable listings with an ADR of $112 and an 80% occupancy rate [3].
Rank One Stays also simplifies the management process. With transparent reporting and a user-friendly owner portal, hosts can easily track financial and operational data. Operating in cities like Scottsdale, Arizona, Denver, Colorado, Pittsburgh, Pennsylvania, and Lighthouse Point, Florida, they offer flexible, month-to-month contracts that free owners from daily management headaches.
Design and Staging for Higher Performance
The way a property looks plays a huge role in attracting bookings. Professional managers study which photos, descriptions, and amenities perform best compared to top competitors [13]. Rank One Stays even offers interior design and staging services to help investors create properties that are ready to generate income from day one.
Staging isn’t just about making a property look nice – it’s about using data to make smart design choices. Properties with professional photos and well-thought-out interiors consistently outperform those with generic setups. Whether it’s a full makeover or targeted updates to boost appeal, these services can transform a property from average to top-tier in its market.
Conclusion
Being a successful Airbnb host isn’t about luck or guesswork – it’s about leveraging data to identify what works and fix what doesn’t. Key metrics like occupancy rate, ADR (Average Daily Rate), and RevPAR (Revenue Per Available Room) give you a clear picture of your property’s performance. With the short-term rental market growing nearly twice as fast as traditional hotels [5], competition is heating up. To stand out, data should guide your pricing, guest experience, and overall strategy.
"Data is the new oil… Analytics, when harnessed effectively, can be that invaluable resource that steers your Airbnb venture towards success." – Autohost [1]
This quote highlights the importance of not just gathering data but actually using it to make informed decisions. Whether you’re relying on Airbnb’s built-in tools or third-party platforms, actionable insights are the key to staying ahead. For example, regularly tracking RevPAR can help you spot issues early – a drop might signal problems with pricing or occupancy [1]. Similarly, addressing guest concerns, like weak Wi-Fi or cleanliness, during their stay can prevent negative reviews and boost satisfaction [1][18]. And don’t overlook historical data: it can help you predict demand spikes from local events or festivals, so you can adjust pricing ahead of time [1][3].
If managing all this feels overwhelming, professional property management services like Rank One Stays can simplify the process. They use advanced analytics, dynamic pricing, and automation to maximize revenue while keeping response rates high. Their clients see an average revenue increase of 38%, with flexible contracts and management fees starting at just 10%.
FAQs
Which Airbnb metric should I prioritize first?
When managing an Airbnb property, the occupancy rate is the key metric you should focus on. This figure tells you how frequently your property is booked relative to its availability. It’s a direct indicator of how appealing your listing is to potential guests and can reveal opportunities to tweak pricing, improve marketing efforts, or adjust availability.
Once you’ve got a handle on occupancy, shift your attention to the Average Daily Rate (ADR). This metric helps you fine-tune your pricing strategy and maximize revenue potential. Together, these two metrics provide a solid foundation for evaluating and improving your property’s performance.
How do I know if I’m priced too high or too low?
To figure out if your Airbnb listing is priced right, start by looking at guest feedback and booking trends. If guests often mention price concerns, your rate might be too high. On the flip side, if your bookings or inquiries are unusually low, your price could be set too low.
You can also use tools like Airbnb analytics or dynamic pricing platforms to track key metrics such as occupancy rates and demand patterns. Adjust your pricing regularly to reflect seasonal shifts, nearby events, and changes in the market. Staying on top of these factors helps keep your listing competitive.
When should I hire a manager like Rank One Stays?
If you’re looking to improve your Airbnb performance without diving into analytics or handling day-to-day operations, consider bringing in a management team like Rank One Stays. They take care of everything from listing optimization and dynamic pricing to guest support and ensuring your property stays competitive in the market. With their expertise, you could see up to a 38% increase in revenue. If juggling tasks like occupancy rates, pricing strategies, or guest satisfaction feels like too much, a professional manager can streamline it all and help your property thrive.