

If you’re an Airbnb host, understanding RevPAN (Revenue Per Available Night) is crucial to measure how effectively your property generates income. Unlike metrics like nightly rate or occupancy, RevPAN gives a clearer picture of your property’s financial performance by accounting for revenue earned per available night, whether booked or not.
Key Takeaways:
- What is RevPAN? Total revenue divided by available nights (nights not blocked for personal use or maintenance).
- Why it matters: It helps identify pricing issues. High occupancy with low RevPAN may indicate underpricing, while high rates with low RevPAN might suggest overpricing.
- Benchmarks: In March 2026, top markets like Scottsdale, AZ, averaged $162 RevPAN for 2-bedroom units, while Nashville, TN, hit $148.
- Improving RevPAN: Use dynamic pricing, optimize listings with professional photos and descriptions, and focus on guest reviews.
Hosts who adopt professional management and dynamic pricing tools often see up to 47% higher annual revenue, making RevPAN a key metric for maximizing profitability.
How to Calculate RevPAN
RevPAN Formula and Examples
The formula for RevPAN is simple: Total Revenue ÷ Available Nights [1][3][2]. It’s important to note that "available nights" exclude periods when the property is blocked for owner stays, maintenance, cleaning, or renovations [2].
Let’s break it down with an example. Imagine a beachfront rental bringing in $6,000 over 30 available nights. Using the formula, the RevPAN comes out to $200 [1]. Now, take another property that earns $1,200 over just 5 available nights. Its RevPAN is $240, showing how fewer available nights can result in a higher RevPAN, even with lower total revenue [2].
Here’s another scenario: if a property has 31 days in August but 14 are blocked for owner use, only 17 nights are available. If the property generates $4,000 in revenue, the RevPAN is approximately $235.29. However, if you mistakenly calculate using all 31 days, the RevPAN drops to about $129.03 – an inaccurate reflection of performance [2].
Grasping these calculations is key to understanding what drives RevPAN and how it can vary.
Factors That Impact RevPAN
While accurate calculations are critical, several factors can influence RevPAN beyond the math itself.
Seasonality is a major driver of RevPAN changes. During peak seasons, higher demand allows for premium pricing, boosting RevPAN even if occupancy isn’t at full capacity [1][8]. For instance, properties managed through Scottsdale vacation rental management experience strong demand from November to April due to snowbird season, while summer tends to be slower [5].
Dynamic pricing is another important factor. By adjusting rates in response to demand, it strikes a balance between occupancy and ADR (Average Daily Rate), which helps optimize RevPAN [1][7]. The type of property also plays a role – luxury rentals, for example, often achieve higher RevPAN due to their elevated nightly rates, even if their occupancy rates are lower [7]. Lastly, owner blocks can skew RevPAN calculations. By reducing the number of available nights, they can make performance appear better than it actually is if not accurately accounted for [2].
sbb-itb-103bddb
What Is RevPAR? The Airbnb Metric You’re Probably Ignoring
RevPAN Benchmarks by Market and Property Type
RevPAN Benchmarks by Market and Property Type for Airbnb Hosts
RevPAN Benchmarks by Market Type
Knowing what’s typical for your market can help you set realistic revenue targets and quickly identify underperformance.
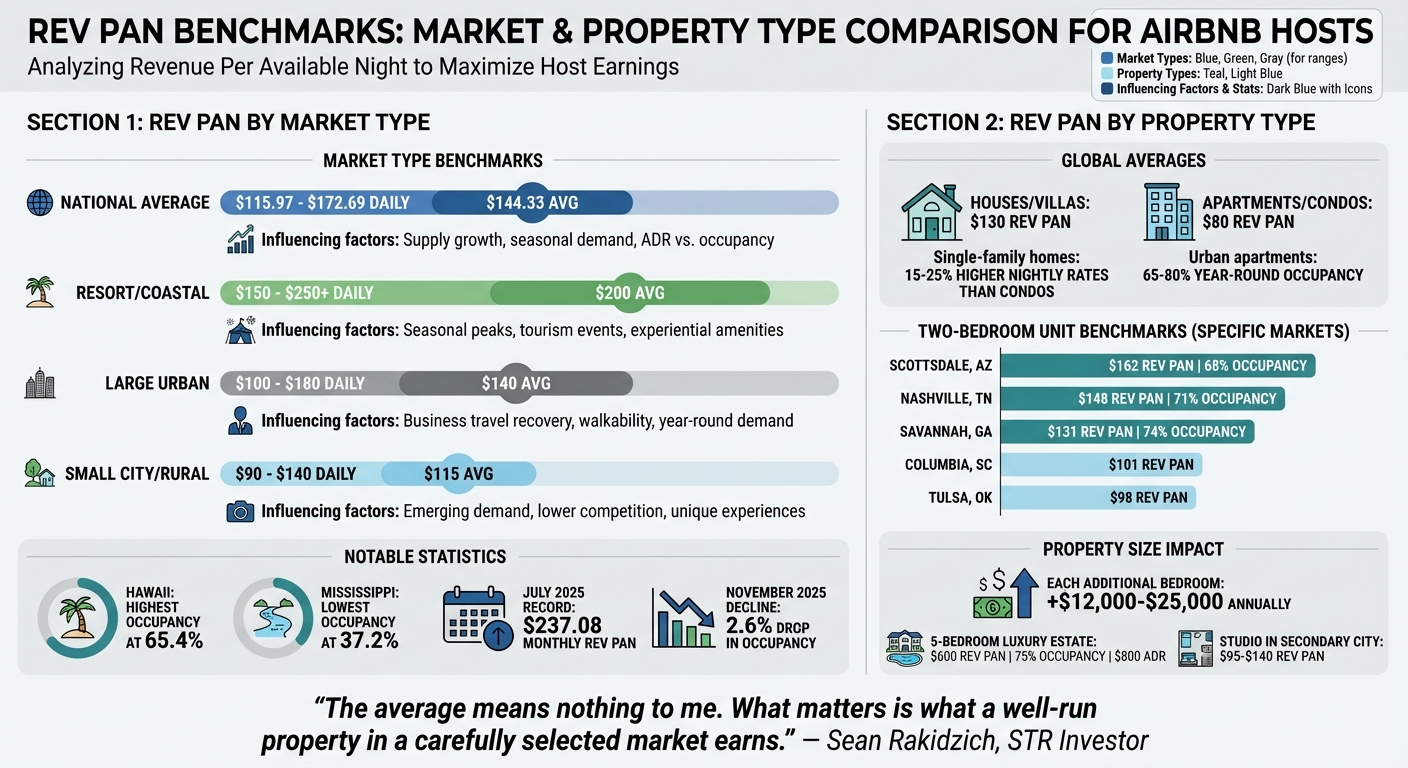
As of November 2025, the national average RevPAN stood at $115.97, a drop from its twelve-month peak of $172.69 in August 2025 [10]. July 2025 saw a record monthly RevPAN of $237.08, highlighting how seasonal trends can significantly influence these figures. The late-2025 decline was largely tied to a 2.6% drop in occupancy, even as nightly rates continued to rise [10].
Smaller city and rural markets saw a 4.6% increase in demand in November, while large suburban markets remained steady [10]. Resort destinations, especially coastal and mountain areas, continued to lead growth, outpacing urban centers still regaining momentum from slower business and international travel [8, 16]. Hawaii boasted the highest occupancy rate in the country at 65.4%, while Mississippi lagged at 37.2% [9].
In late 2025, some markets with the fastest ADR growth, such as Long Island (+19.6%), experienced notable occupancy declines. This shift suggests a move toward premium pricing over volume. The table below outlines key market-level benchmarks:
| Market Type | RevPAN Range (Daily) | Primary Influencing Factors |
|---|---|---|
| National Average | $115.97 – $172.69 | Supply growth, seasonal demand, ADR vs. occupancy |
| Resort/Coastal | $150 – $250+ | Seasonal peaks, tourism events, experiential amenities and professional interior design |
| Large Urban | $100 – $180 | Business travel recovery, walkability, year-round demand |
| Small City/Rural | $90 – $140 | Emerging demand, lower competition, unique experiences |
These benchmarks provide a foundation for refining revenue strategies based on market type. But property type adds another layer of nuance.
RevPAN Benchmarks by Property Type
The type of property you manage plays a major role in revenue potential.
Larger properties like houses and villas consistently outperform smaller units like apartments and condos. Globally, houses and villas average a RevPAN of $130, compared to $80 for smaller units [11]. Single-family homes often command 15–25% higher nightly rates than condos in the same vacation destinations [12]. While urban apartments maintain 65%–80% occupancy year-round, larger vacation homes experience more pronounced seasonal fluctuations [12].
For two-bedroom units, specific benchmarks highlight the potential in certain markets. For example:
- Scottsdale: RevPAN of $162 at 68% occupancy
- Nashville: RevPAN of $148 with 71% occupancy
- Savannah: RevPAN of $131 at 74% occupancy [5]
Markets managed by professional teams – like those offering Scottsdale vacation rental management – make these benchmarks more achievable. Meanwhile, emerging markets like Columbia, SC ($101) and Tulsa, OK ($98) show lower RevPAN but remain profitable with the right rent-to-revenue balance [5].
Adding bedrooms can significantly boost revenue. Each extra bedroom can generate an additional $12,000–$25,000 annually [6]. For example, a five-bedroom luxury estate might achieve a RevPAN of $600 with 75% occupancy and an ADR of $800, while a studio in a secondary city might range between $95 and $140 [6, 15]. Success comes down to balancing your property’s ADR potential with realistic occupancy expectations for your market and property type.
"The average means nothing to me. What matters is what a well-run property in a carefully selected market earns." – Sean Rakidzich, STR Investor [6]
How to Improve Your RevPAN
Dynamic Pricing for Revenue Growth
Sticking to a fixed price can leave money on the table. Hosts who use dynamic pricing strategies typically see 15–36% higher revenue compared to those who set a single rate and forget it [13]. Why? Because demand fluctuates daily due to market conditions and local events, and your pricing needs to keep up.
Using rule sets and automation can help you adjust rates based on booking trends. For example, if your dates are booking faster than the market average, increase prices by 5–20%. On the flip side, if your property remains unbooked within three days of check-in, lower rates by 5–15% to attract last-minute guests [17]. Big cities often benefit from aggressive last-minute discounts, while smaller markets may see better results with early-bird pricing [13].
Length-of-stay and gap-fill discounts are also key to maximizing occupancy while keeping turnover costs low. Offering 10–15% off weekly stays, 20–30% off monthly stays, or 10–15% off one- or two-night gaps between bookings can increase profits by 10–15% compared to short-term-only pricing models [13][14][15].
"The price is not what you want to charge. The price is what the market will pay at that moment in time." – Sean Rakidzich, Short-Term Rental Expert [14]
A great example of dynamic pricing in action comes from John An and the TechTape team. In 2022 and 2023, they managed a 12-bedroom mansion in New Jersey. By combining data from smaller high-end homes to create a "mosaic comp set", they raised the property’s gross booking revenue from $185,000 in 2021 to $345,000 by the end of 2023 – a year-over-year increase of about 36% [16]. Weekly pricing adjustments can lead to a 25% average increase in annual revenue [15].
Once your pricing strategy is in place, the next step is making sure your listing stands out with a polished presentation.
Listing Optimization for Higher Bookings
Think of your listing as your storefront – it’s the first thing potential guests see, and its quality directly impacts your bookings. Hosts who optimize their titles, photos, and descriptions report 30–60% more bookings than those who don’t [18].
Start with your title, keeping it under 50 characters and highlighting a specific feature, like "Skyline Views" or "Cozy Fireplace." Update it seasonally to match guest interests, such as "Ski Cabin" in the winter or "Beachfront Escape" in the summer [18].
Photos are crucial. They’re often the deciding factor for guests, so aim for 25–35 high-quality images. Focus on the first five photos, showcasing your property’s best features, the living area, and the kitchen. Use landscape orientation and natural lighting – golden hour lighting works especially well for your cover photo [18].
Your description should feel inviting and give a glimpse of the guest experience, not read like a real estate ad. Keep it concise at 150–250 words, and make the first 2–3 sentences compelling since this is what guests see before clicking "Show more" [18][19]. Be upfront about any potential drawbacks, like street noise or stairs, to avoid negative reviews that could hurt your revenue [18]. Properties that use professional design services often see faster booking rates due to their polished presentation.
Once you’ve nailed these basics, it’s time to focus on strategies for launching new listings.
Launching New Listings with Competitive RevPAN
New listings face a tough start: no reviews, no visibility, and no bookings. To overcome this, focus on occupancy over revenue during the first 30 days. Start by pricing your property 10–20% below the market average to secure your first 5–10 reviews and boost your search ranking [21].
The importance of reviews can’t be overstated. For example, in 2026, a property with a 5-star average commanded an ADR (average daily rate) of $225. Dropping to 4.9 stars reduced that rate by 10% to $200, while properties below 4.5 stars had to settle for just $169 to stay competitive [20].
To calculate your initial price, add up your fixed costs (like mortgage, utilities, and insurance) and a profit margin of 30–50%. Then, compare this figure to the market average by researching at least 10 similar properties within a one-mile radius [21]. If your listing books out within 48 hours, your price might be too low. If you don’t get any inquiries for two weeks, it’s likely too high [21].
"73% of something beats 100% of nothing. Every empty night is a sunk cost. Fill the gap, build your reviews, and work on raising your base rate over time." – Sean Rakidzich, Short-Term Rental Expert [13]
Dynamic pricing and listing optimization are essential from day one. By combining these strategies, you can overcome the initial hurdles and start building momentum. Hosts who adopt smart pricing tools typically earn 47% more annually than those who stick to static rates [21]. Markets like Denver vacation rental management or Pittsburgh vacation rental management benefit from automated tools that adjust rates daily based on demand, seasonality, and local events.
Achieving Above-Market RevPAN with Professional Management
DIY vs. Professional Management
If you’re aiming to achieve above-market RevPAN (Revenue per Available Night), professional management can make a world of difference. While DIY management might seem like a cost-saving route, it often leaves 30%–50% of potential revenue on the table due to inefficient pricing strategies [6]. For example, the median annual Airbnb income for self-managed properties in the U.S. is about $14,000, whereas professionally managed properties consistently exceed this figure [6].
DIY hosts often rely on manual pricing adjustments and static rules for minimum stays. This approach can lead to unbooked "orphan nights" and missed opportunities, especially during high-demand events. Take the 2026 Super Bowl in Santa Clara as an example – 16% of bookings happened before the teams were even announced [20]. Without automated tools to detect demand early, these valuable bookings are easily lost.
Professional management, on the other hand, uses advanced tools like dynamic pricing algorithms, AI-driven listing optimization, and full guest support. These services are key to maintaining high property ratings, which directly impact revenue. A small ratings drop from 5.0 to 4.9 stars can cause a 10% reduction in ADR (Average Daily Rate), from $225 to $200 [20]. Properties rated below 4.5 stars face even steeper pricing challenges, with ADR falling to just $169 to remain competitive [20].
"As the gap between 5-star and 4-star revenue widens, automation is no longer optional – it is the engine of growth." – Guneet Lamba, PriceLabs [20]
By adopting automated dynamic pricing and ensuring operational excellence, professional management not only prevents revenue losses but actively boosts your RevPAN.
How Rank One Stays Maximizes RevPAN
Rank One Stays has proven its ability to help property owners earn 38% more revenue than the market average, with management fees starting as low as 10% [22]. This success comes from combining cutting-edge dynamic pricing tools with full-service property management. For instance, professional photography alone can increase earnings by 40% [6]. Add to this their use of guest review sentiment analysis to address operational issues before they impact ratings, and multi-channel marketing across platforms like Airbnb, VRBO, and Booking.com [22].
Rank One Stays takes care of cleaning, maintenance, damage claims, and inventory management, offering property owners truly passive income without the headaches of daily operations [22]. With 24/7 guest support and an impressive 4.93/5 rating from over 1,860 guests [22], properties managed by Rank One Stays maintain their "Guest Favorite" status, which is crucial for staying competitive and preserving pricing power. Whether you’re managing properties in Scottsdale, Denver, Pittsburgh, or Lighthouse Point, professional management ensures above-market RevPAN with ease and efficiency.
Conclusion
Tracking RevPAN (Revenue Per Available Night) offers a clear picture of how well your listing performs, showing exactly how much revenue you bring in for every available night [3][4]. Benchmarks can vary widely depending on location – $162 per night in Scottsdale, AZ versus $118 in Colorado Springs, CO [5] – and larger properties tend to outperform smaller ones.
But here’s the kicker: many hosts lose out on 30% to 50% of potential revenue because of pricing mistakes and inefficient strategies [6]. Sean Rakidzich, an STR investor, explains:
"Most Airbnb hosts earn 50–70% of what their property is capable of producing. The gap between potential and actual earnings is almost entirely caused by pricing errors" [6].
It’s no surprise that hosts who actively adjust pricing monthly earn 40% or more than those who set it and forget it [6]. On top of that, professional photography can increase earnings by 40%, and maintaining high guest ratings is crucial. Even a slight drop from 5.0 to 4.9 stars can have a noticeable impact on revenue.
To achieve above-market RevPAN, you’ll need a mix of dynamic pricing, optimized listings, professional photography, and consistently glowing guest reviews. These strategies highlight the advantage of professional vacation rental management, which helps close the gap between what your property earns now and what it could earn.
For property owners in places like Scottsdale, Denver, Pittsburgh, or Lighthouse Point, professional management can turn current earnings into the full potential your property is capable of. With clear benchmarks and expert strategies, achieving – and even exceeding – market RevPAN becomes a predictable outcome.
FAQs
What should I include in ‘total revenue’ for RevPAN?
In the context of RevPAN, total revenue refers to all the income earned from a rental property within a specific time frame. This includes:
- Nightly rates: The base charge for renting the property.
- Cleaning fees: Additional fees for maintaining the property’s cleanliness.
- Other charges: Any extra applicable fees tied to the rental.
It’s important to note that this figure represents the gross income – calculated before subtracting any expenses.
How many owner-blocked nights is too many for accurate RevPAN?
When it comes to owner-blocked nights, there’s no universal benchmark to define what’s “too many.” However, the more nights you block for personal use, the fewer opportunities you have for bookings. This directly impacts your revenue potential and can skew the accuracy of Revenue Per Available Night (RevPAN) as a performance indicator. To keep your RevPAN data meaningful and reflective of your property’s performance, it’s best to limit owner-blocked nights as much as you can.
What’s a good RevPAN goal for my market and property size?
Aiming for a solid RevPAN (Revenue per Available Night) target depends largely on your market and the size of your property. In many U.S. markets, industry standards suggest that $100 per night is the baseline for profitability. In more competitive areas, this figure can climb to $100-$150 or more. To hit or surpass these benchmarks, working with professional management companies like Rank One Stays can make a difference. They use dynamic pricing and market insights to fine-tune your strategy and maximize revenue.