
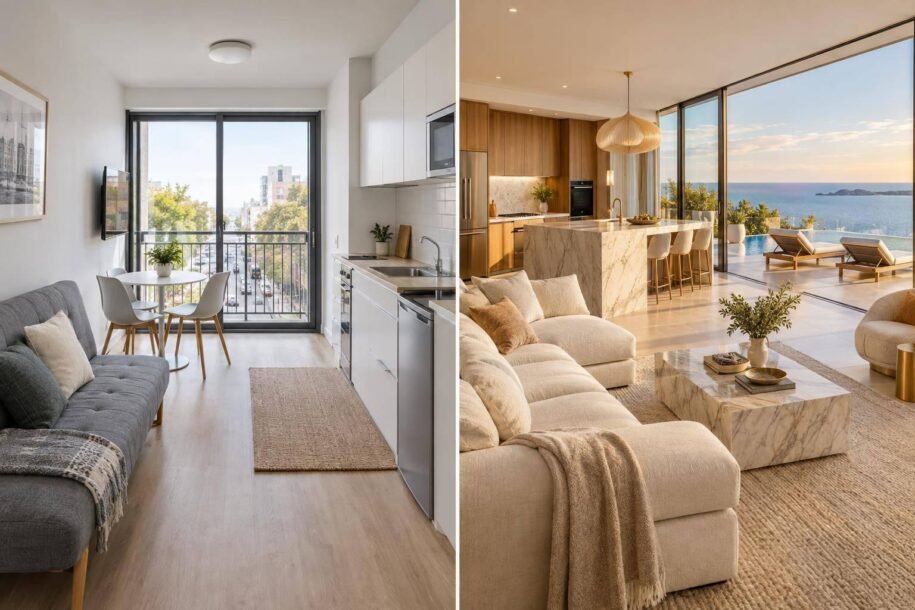
I’d compare cash left after expenses, debt, and reserves – not nightly rates. In the article’s hypothetical models, Scottsdale luxury earns a 1.15% cash-on-cash return, versus 0.27% for Pittsburgh budget. Neither leaves much room for weaker bookings or unexpected repairs.
My takeaway: luxury offers higher revenue but needs more cash and service. Budget costs less to buy, but lower rates can leave thin margins. Neither wins by default.
Quick Comparison
| Factor | Scottsdale luxury | Pittsburgh budget |
|---|---|---|
| Total cash invested in the model | $315,000 | $121,250 |
| Annual cash flow after debt and reserves | $3,625 | $325 |
| Demand | Winter and spring peaks; weaker summers | Medical, university, business, and event travel |
| Setup and upkeep | Pool, outdoor areas, premium furnishings | Durable furniture, reliable basics, older-system repairs |
| Management | Fast guest support and amenity checks | Tight cost control and efficient cleaning |
| Main risks | Seasonal dips and expensive repairs | Low margins and neighborhood-specific demand |
Before buying, I’d <u>check the exact address’s rental rules</u>, get insurance and maintenance quotes, and compare DIY costs with management fees. Then I’d test lower rates, fewer bookings, and added repairs using the same financing assumptions. That’s how I’d judge whether either property fits my cash reserves and return target.
I Ranked Every Airbnb Investment for 10 Years – Here’s What Actually Made Money
sbb-itb-103bddb
Rental Rates, Demand, and Entry Costs in Scottsdale and Pittsburgh
The city shapes demand; the property tier shapes price. Assess each market separately, and keep acquisition, setup, and reserve costs distinct.
The table below shows how guest demand and setup needs vary by property type.
| Property type | Likely guests | Setup cost | Demand pattern |
|---|---|---|---|
| Scottsdale luxury home | Golf travelers, vacation groups, event visitors | Larger furnishing budget; pool and outdoor improvements | Strong winter and spring demand; summer slowdown |
| Scottsdale smaller rental | Couples, smaller vacation groups | Fewer furnishings; fewer amenities to maintain | Same seasonal market, but different pricing and guest capacity |
| Pittsburgh budget apartment | Medical, university, and business travelers | Practical furniture, reliable Wi-Fi, safety equipment | Multiple demand sources; neighborhood access matters |
| Pittsburgh higher-priced rental | Families, groups, sports visitors | More beds, seating, linens, and replacement inventory | Group demand and local calendars influence bookings |
Scottsdale Luxury: Nightly Rates, Seasons, and Setup Costs
AirDNA reported approximately 58% occupancy and $208 revenue per available night (RevPAR) for the year ending May 2026. Those figures cover the market, not luxury homes alone.[3] A separate analysis for July 2025–June 2026 reported occupancy near 74% in March versus 35% in June.[2] Build those seasonal shifts into your estimates instead of assuming peak demand lasts all year. A higher average daily rate (ADR) only works when enough guests book at that price.
Both hypothetical tables assume 365 available nights over the same 12 months. These are illustrations, not forecasts. Gross accommodation revenue equals ADR × 365 × occupancy; RevPAR equals ADR × occupancy.
Metric Luxury pool home Smaller local rental Bedrooms 4 2 Average daily rate (ADR) $450 $240 Occupancy 55% 60% Gross accommodation revenue $90,338 $52,560 RevPAR $247.50 $144.00 Cost profile Higher pool, landscaping, utilities, insurance, and replacement costs Lower furnishing and maintenance burden Amenities Heated pool, outdoor kitchen, upgraded furnishings Wi-Fi, practical kitchen, comfortable beds, workspace
Before accepting bookings, separate the purchase price from furniture, linens, photography, safety equipment, licensing, insurance, initial repairs, and reserve cash. Get quotes for pool and HVAC work. A furnished home may cost less to set up than a vacant one.
Event demand doesn’t override city, HOA, insurance, or platform rules. Clearly state occupancy, parking, visitor, and quiet-hour limits upfront.
Pittsburgh Budget: Purchase Costs and Guest Demand
Focus on access to guest destinations, durable furniture, Wi-Fi, laundry, and easy check-in rather than expensive décor. Airbtics reported approximately $138 median ADR, 63% median occupancy, and $33,000 median annual revenue for February 2025–January 2026.[1] These market medians aren’t forecasts for a specific apartment. A lower entry cost only works if steady occupancy makes up for smaller nightly rates.
Metric Budget apartment Higher-priced local rental Bedrooms 1 2–3 Acquisition price $180,000 $325,000 ADR $125 $210 Occupancy 60% 55% Gross annual accommodation revenue $27,375 $42,068 Setup cost $18,000 $35,000 Annual upkeep assumption Lower-to-moderate repairs and turnover costs Higher furnishings, utilities, repairs, and turnover costs Gross yield 15.2% 12.9%
Gross yield is annual gross revenue divided by purchase price. It doesn’t account for expenses, debt, or cash-on-cash return. Beyond the purchase, budget for spare linens, cleaning supplies, smart access, photography, insurance, compliance, and reserves.
Confirm Pittsburgh’s current permit and inspection requirements before launch. Short stays increase turnover costs. Longer stays reduce cleaning needs but bring discounts, screening, and utility risk. Expenses and financing also need to be factored in when testing net returns. Many investors use professional property management to stabilize these expenses and optimize income.
Luxury vs Budget: Net Returns and Investment Risk
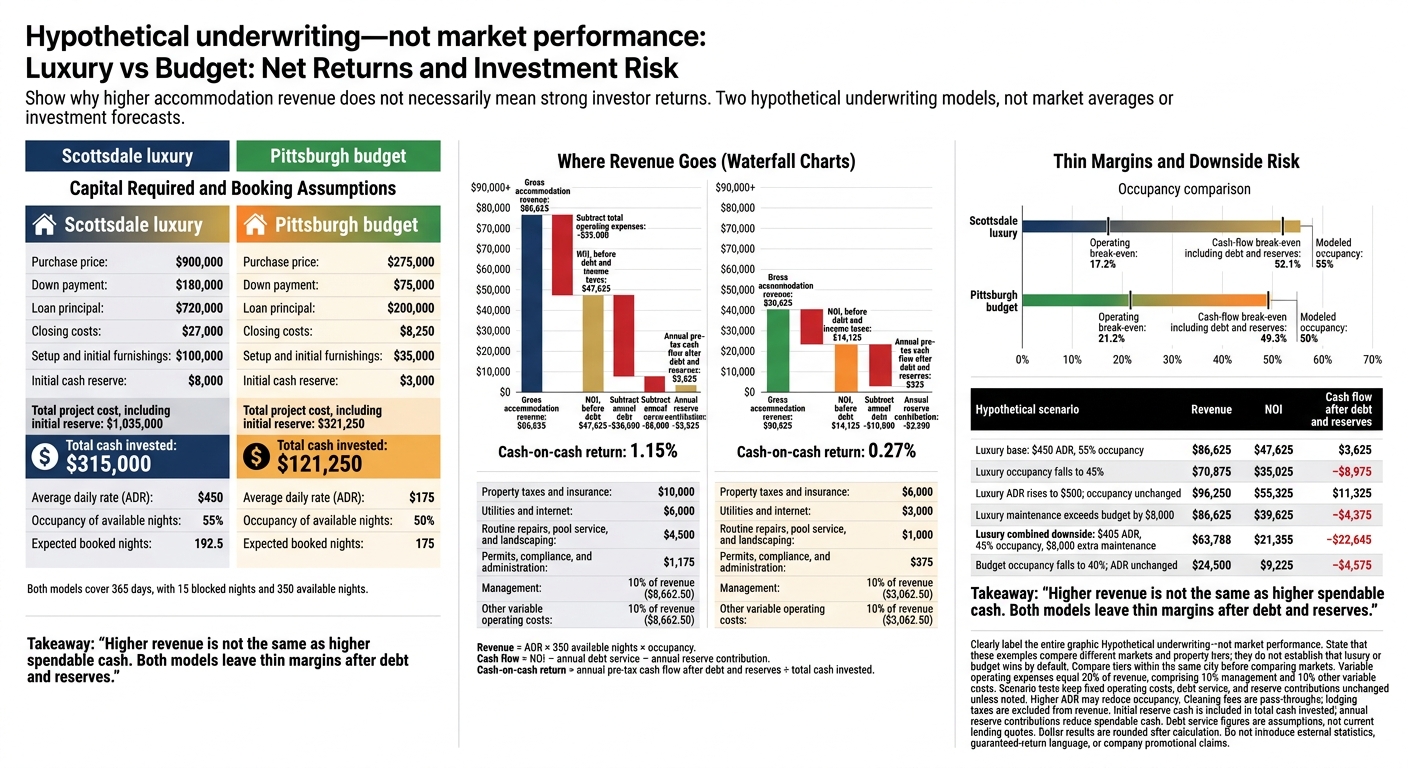
Luxury vs Budget Airbnb: Revenue to Real Returns
Luxury offers a higher revenue ceiling – but puts more capital at risk. Compare tiers within the same city before comparing markets. For Scottsdale, account for seasonality and replacement costs. For Pittsburgh, weigh neighborhood demand and the option to switch to other rental uses. Test NOI, debt service, reserves, and break-even occupancy before deciding which tier fits your investment.
| Factor | Luxury Airbnb | Budget Airbnb |
|---|---|---|
| Rates and occupancy | Higher ADR; more reliance on premium demand | Lower ADR; affordability and location support demand |
| Acquisition and setup | More capital tied up in the property and amenities | Lower entry cost, though prime locations can increase purchase prices |
| Furnishings and amenities | Higher furnishing and replacement costs | Durable, replaceable furnishings and practical amenities |
| Cleaning and maintenance | Higher turnover costs and reserve needs | Lower cost per turnover; frequent bookings and aging systems can increase annual expenses |
| Guest expectations | Fast issue resolution and hotel-level service | Cleanliness, value, accuracy, and reliability |
| Seasonality and revenue swings | Revenue concentrated in peak season can create sharp swings | Broader demand may help, but limited pricing power leaves margins exposed |
| Cash flow | Sensitive to fixed costs, debt, and concentration risk | Lower entry cost, but lower ADR and repairs can squeeze margins |
| Resale or other uses | Potential appeal to luxury buyers and second-home users | Potential mid-term or long-term rental fallback |
Calculate Revenue, NOI, and Cash-on-Cash Return
Hypothetical underwriting – not market performance. Both models cover 365 days, with 15 blocked nights and 350 available nights. Use unrounded booked nights in the revenue math. Treat cleaning fees as pass-throughs and exclude lodging taxes from revenue. Fixed costs below include property taxes, insurance, utilities, routine upkeep, and permits or administration. Model variable operating costs at 20% of revenue. Model management as a separate expense line, because fees can erase budget-property margins. For this illustration, that 20% comprises 10% management and 10% other variable costs.
Hypothetical assumption or result Scottsdale luxury Pittsburgh budget Purchase price $900,000 $275,000 Down payment / loan principal $180,000 / $720,000 $75,000 / $200,000 Closing costs $27,000 $8,250 Setup and initial furnishings $100,000 $35,000 Initial cash reserve $8,000 $3,000 Total project cost, including initial reserve $1,035,000 $321,250 Total cash invested $315,000 $121,250 ADR / occupancy of available nights $450 / 55% $175 / 50% Expected booked nights 192.5 175 Revenue: ADR × 350 × occupancy $86,625 $30,625 Property taxes and insurance $10,000 $6,000 Utilities and internet $6,000 $3,000 Routine repairs, pool service, and landscaping $4,500 $1,000 Permits, compliance, and administration $1,175 $375 Management: 10% of revenue $8,662.50 $3,062.50 Other variable operating costs: 10% of revenue $8,662.50 $3,062.50 Total operating expenses $39,000 $16,500 NOI, before debt and income taxes $47,625 $14,125 Annual debt service $36,000 $10,800 Annual reserve contribution $8,000 $3,000 Annual pre-tax cash flow $3,625 $325 Cash-on-cash return 1.15% 0.27%
Cash-on-cash return = annual pre-tax cash flow after debt and reserves ÷ total cash invested.[5] Include initial reserve cash in the denominator. Annual reserve contributions reduce the cash you can spend. Luxury produces more NOI dollars here, but financing and reserves leave a thin return. The debt service figures are assumptions, not current lending quotes.
Test Changes in Rates, Occupancy, and Maintenance Costs
These tests keep fixed operating costs, debt service, and reserve contributions unchanged unless noted. Variable expenses stay at 20% of revenue. A higher ADR may lower occupancy if guests aren’t willing to pay the new price.
Hypothetical scenario Revenue NOI Cash flow after debt and reserves Luxury base: $450 ADR, 55% occupancy $86,625 $47,625 $3,625 Luxury occupancy falls to 45% $70,875 $35,025 −$8,975 Luxury ADR rises to $500; occupancy unchanged $96,250 $55,325 $11,325 Luxury maintenance exceeds budget by $8,000 $86,625 $39,625 −$4,375 Luxury combined downside: $405 ADR, 45% occupancy, $8,000 extra maintenance $63,788 $21,355 −$22,645 Budget occupancy falls to 40%; ADR unchanged $24,500 $9,225 −$4,575 Dollar results are rounded after calculation.
Treat Scottsdale as a seasonal market. Winter rates and occupancy can support cash flow, while weaker summer demand adds turnover pressure and lowers annual returns.
Break-even must cover more than operating bills. With fixed costs (F), available nights (A), and variable cost per booked night (v), operating break-even occupancy is F ÷ [A × (ADR − v)]. For cash-flow break-even, add debt service and annual reserves to the numerator.
In these models, luxury covers operating costs at 17.2% occupancy, but needs 52.1% to cover debt and reserves. Budget needs 21.2% and 49.3%, respectively. Fixed costs don’t stop when bookings slow. Before choosing a property tier, test whether bookings can cover debt, reserves, and maintenance. Those numbers also guide management choices and operating cost control.
Managing Luxury and Budget Rentals
The numbers may work on paper, but day-to-day management determines whether they hold up.
Match Guest Service and Upkeep to the Property
Match your service to the stay you sell. Luxury homes need more hands-on guest support and faster repairs. Budget rentals need consistent service and low-cost turnovers.
Spell out sleeping arrangements, parking, stairs, rules, accessibility details, and amenity limits. Use premium photography for luxury homes and clear, practical photos for budget units. Update images whenever the property changes.
| Operating task | Luxury priorities | Budget priorities |
|---|---|---|
| Pricing and calendar | Make the most of peak demand; adjust for booking pace and seasonality | Control discounts; use minimum stays to limit costly turnovers |
| Guest communication | Check amenities before issues arise and provide fast human responses | Automate check-in instructions, with a person available when needed |
| Turnover control | Inspect staging, appliances, linens, and outdoor areas | Standardize cleaning, restocking, and checks on high-use items |
| Maintenance urgency | Pool equipment, HVAC, outdoor amenities, and premium fixtures | Locks, plumbing, HVAC, moisture, and aging systems |
| High-value asset protection | Photograph high-value items and track replacement costs | Standardize supplies and recount after each turnover |
| Replacement risk | Budget for premium furnishings and amenity replacements | Use durable furnishings that are easy to replace |
When you own remotely, coordinating listings, pricing, and maintenance in one place becomes more useful. Rank One Stays can centralize pricing, guest support, housekeeping, maintenance, inventory, and damage claims for remote owners.[6]
In Scottsdale, confirm arrangements for pool care and heat-related maintenance. In Pittsburgh, check freeze protection, older-system upkeep, and efficient turnovers. In either market, verify local response coverage and which charges are billed separately.
Keep a dated inventory with photos, receipts, quantities, and replacement costs. Require damage checks before the next guest arrives. Airbnb’s guidance calls for reimbursement requests within 14 days of checkout.[7] Host damage protection does not replace insurance.[8] Treat design and furnishing as setup costs, with a separate reserve for replacements.
Who runs the property also affects costs.
DIY vs Professional Management: Costs and Cash Flow
Compare both options using the same ADR, occupancy, financing, and reserve assumptions. Your management choice changes NOI through paid labor, fees, and repair control.
| Comparison | DIY management | Professional management |
|---|---|---|
| Management fee | No third-party management fee | Contracted percentage plus any additional charges |
| Owner workload | Pricing, messaging, vendor coordination, inspections, and emergencies | Approvals and statement review; verify which tasks are delegated |
| Operating costs | Direct vendor, supply, software, and travel expenses | Verify pass-through costs, repair markups, and project charges |
| Reporting | Owner maintains booking and expense records | Require itemized statements and reconciliation |
| Cash flow at identical revenue | Deduct operating costs, debt, and reserves | Use the same calculation, including contracted charges; count only documented savings |
Rank One Stays reports fees starting at 10%, a 38% revenue advantage over the market average, an owner portal, and month-to-month terms. These are company-reported results, not guaranteed returns.[6]
Request a property-level projection, then verify the fee base, exclusions, reporting, and termination terms. Test revenue gains separately against comparable local properties during matching seasons. Don’t count the same occupancy gain twice or treat unpaid owner labor as cash flow.
Conclusion: Choose by Capital, Costs, and Net Returns
Choose based on total cash required and dependable net returns – not the highest nightly rate. Comparing rates, costs, and net operating income (NOI) shows where these two strategies differ:
| Decision factor | Scottsdale luxury rentals | Pittsburgh budget rentals |
|---|---|---|
| Property | Multi-bedroom home with a pool and outdoor amenities | Smaller apartment or modest house near employment centers, universities, hospitals, sports venues, or transit |
| Guests | Families, golf travelers, and affluent leisure groups | Price-sensitive travelers, visiting professionals, families visiting students, and extended-stay guests |
| Demand periods | Winter travel, February–March peaks, and major events | University visits, healthcare, business travel, sports events, and weekend tourism |
| Capital needs | Higher purchase, setup, and replacement costs | Generally lower entry costs, though older properties may have deferred maintenance or code issues |
| Management demands | Premium service and reliable amenities | Efficient turnovers and tight cost control |
| Return risks | Weak off-season demand and costly amenity failures | Thin margins, neighborhood-specific demand, and older-building repairs |
These trade-offs drive the decision. A midmarket property can offer a balance between capital needs, demand, and management workload.
Before buying, check current market data, eligibility at the exact address, zoning, HOA restrictions, taxes, insurance, and actual operating costs. Scottsdale requires a license for stays under 30 days, with a reported annual fee of $250 per property.[9] Also confirm liability coverage of at least $500,000 before purchase.[4][11] Check Pittsburgh’s rules directly with the city; proposals are not enacted rules.[10]
Test base, downside, and severe downside cases before buying. Use those scenarios to assess whether the property can deliver reliable net returns, keep potential losses within your limits, and avoid relying on peak months.
FAQs
How much cash should I keep for slow months and repairs?
Set aside three to six months of operating expenses as a cash reserve. That cushion helps cover seasonal slowdowns and unexpected repairs, so you can tackle maintenance promptly and protect your property’s guest rating.
Rank One Stays handles maintenance, damage claims, and inventory management in markets like Scottsdale and Pittsburgh. It also uses dynamic pricing and professional management to optimize revenue, leaving you free to focus on keeping your reserve funded.
How can I validate demand for a specific property?
Compare at least 10 similar listings within a one-mile radius to set a pricing baseline. If your property books out within 48 hours, your rates may be too low. If you get no inquiries for two weeks, they may be too high.
Rank One Stays offers listing optimization and dynamic pricing tools that adjust rates daily based on real-time demand, seasonality, and local events. These tools help you validate demand and keep your property competitive.
When should I switch to mid-term or long-term rentals?
Consider switching to mid-term or long-term rentals if seasonal shifts leave your property empty for long stretches or short-term rental revenue falls below your profit goals. Longer stays can help steady your income when market swings make revenue per available night (RevPAN) inconsistent.
Rank One Stays uses dynamic pricing and expert market analysis to assess whether your property is reaching its full potential – or whether a different rental approach could maximize returns.